Copy the Data Source data file to clipboard
You can now copy your Data Source data file to the clipboard. Click the Copy data file button to copy the Data Source data file to the clipboard from multiple places:
- Pop up menu in Data Sources list
- Pop up menu in Data Source detail view
- Schema tab in Data Source detail view
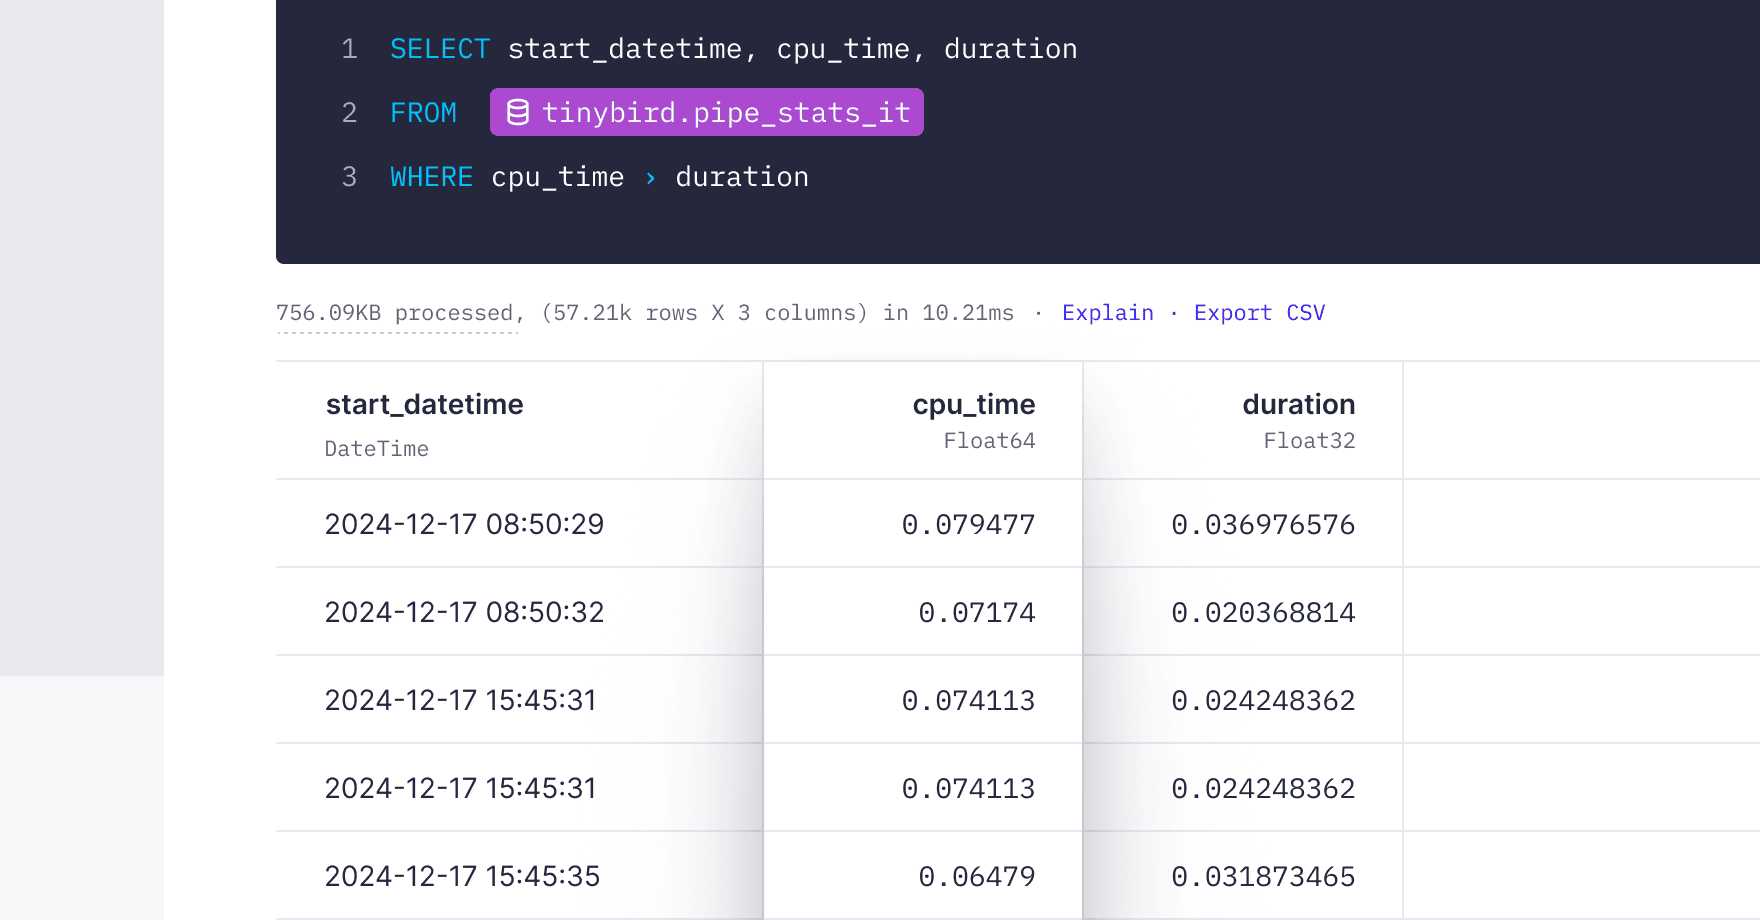
New column cpu_time in pipe_stats_rt and datasources_ops_log
We added a new column cpu_time in the pipe_stats_rt and datasources_ops_log tables. This column shows the CPU time used by the query and operations done to your Data Sources.
Using this new column, you can identify endpoints you can compare the duration of the request and the CPU time used to identify if the endpoint is CPU bound and optimize it.

Currently, we don't report CPU time with granularity for each materialized view. When you insert data into a table that has dependent materialized views, the CPU time will be reported as a single value in the landing table, including both the insert operation and all the work done by the materialized views. We are also working on adding CPU time reporting for operations like truncate and replace.
Define your S3 Sink write strategy from CLI
Now you can define the write strategy for your S3 Sinks using Tinybird CLI. Follow the instructions in the Sinks documentation to get started.
Bug fixes
- Fixed an issue where updates on a node (in Pipes or Playgrounds) where lost when opening in the fullscreen mode without running the query.
- We fixed an issue where it was not possible to run wrong queries in both the Data Source log editor and the quarantine editor.
- Only allow adding data skipping indexes available. Removed support for experimental. Check docs.