Tinybird 101
Tinybird provides you with a simple way to ingest and query large amounts of data with low latency, and instantly create API Endpoints to consume those queries. This means you can easily build fast and scalable applications that query your data; no backend needed!
Example use case: ecommerce
This walkthrough demonstrates how to build an API Endpoint that returns the top 10 most searched products in an ecommerce website. It follows the process of "ingest > query > publish".
- First, you'll ingest a set of ecommerce events based on user actions, such as viewing an item, adding items to their cart, or going through the checkout. This data is available as a CSV file with 50 million rows.
- Next, you'll write queries to filter, aggregate, and transform the data into the top 10 list.
- Finally, you'll publish that top 10 result as an HTTP Tinybird API Endpoint.
Prerequisites
There are no specific prerequisites - you can start from the very beginning, without a Tinybird account. If you need help, reach out to us on support@tinybird.co.
This quick start walkthrough uses the web UI (not the Tinybird CLI), and doesn't use version control features. Both are great additions to your next Tinybird project, but not necessary to get up and running.
Here's why:
Using version control: There are two distinct workflows you can use when building Tinybird projects: with version control and without version control. Tinybird has an extensive feature set that supports Git-based, version-controlled development, including creating feature Branches, managing Pull Requests with integrated CI/CD scripts.
As your Tinybird projects get more complex and your team of collaborators grows, the version control workflow becomes more critical. However, this walkthrough focuses on understanding the platform and its capabilities, so it's fine to build without the version control features.
Using the web UI versus the CLI: In addition to the Tinybird UI, there is also a Tinybird command line interface (CLI) for building and managing projects. If you're using the version control workflow, the CLI is the best option, and comes complete with methods for creating and navigating Branches.
This example uses the web UI.
Your first Workspace
Wondering how to create an account? It's free! Start here.
After creating your account, select a region, and name your Workspace. You can call the Workspace whatever you want; generally, people name their Workspace after the project they are working on. As you learn Tinybird, you are likely to create multiple Workspaces, so descriptive names are helpful. You can always rename a Workspace in the future.
Leave the template menu blank. Welcome to your new Workspace!
1. Create a Data Source
Tinybird can import data from many different sources, but let's start off simple with a CSV file that Tinybird has posted online for you.
Add the new Data Source
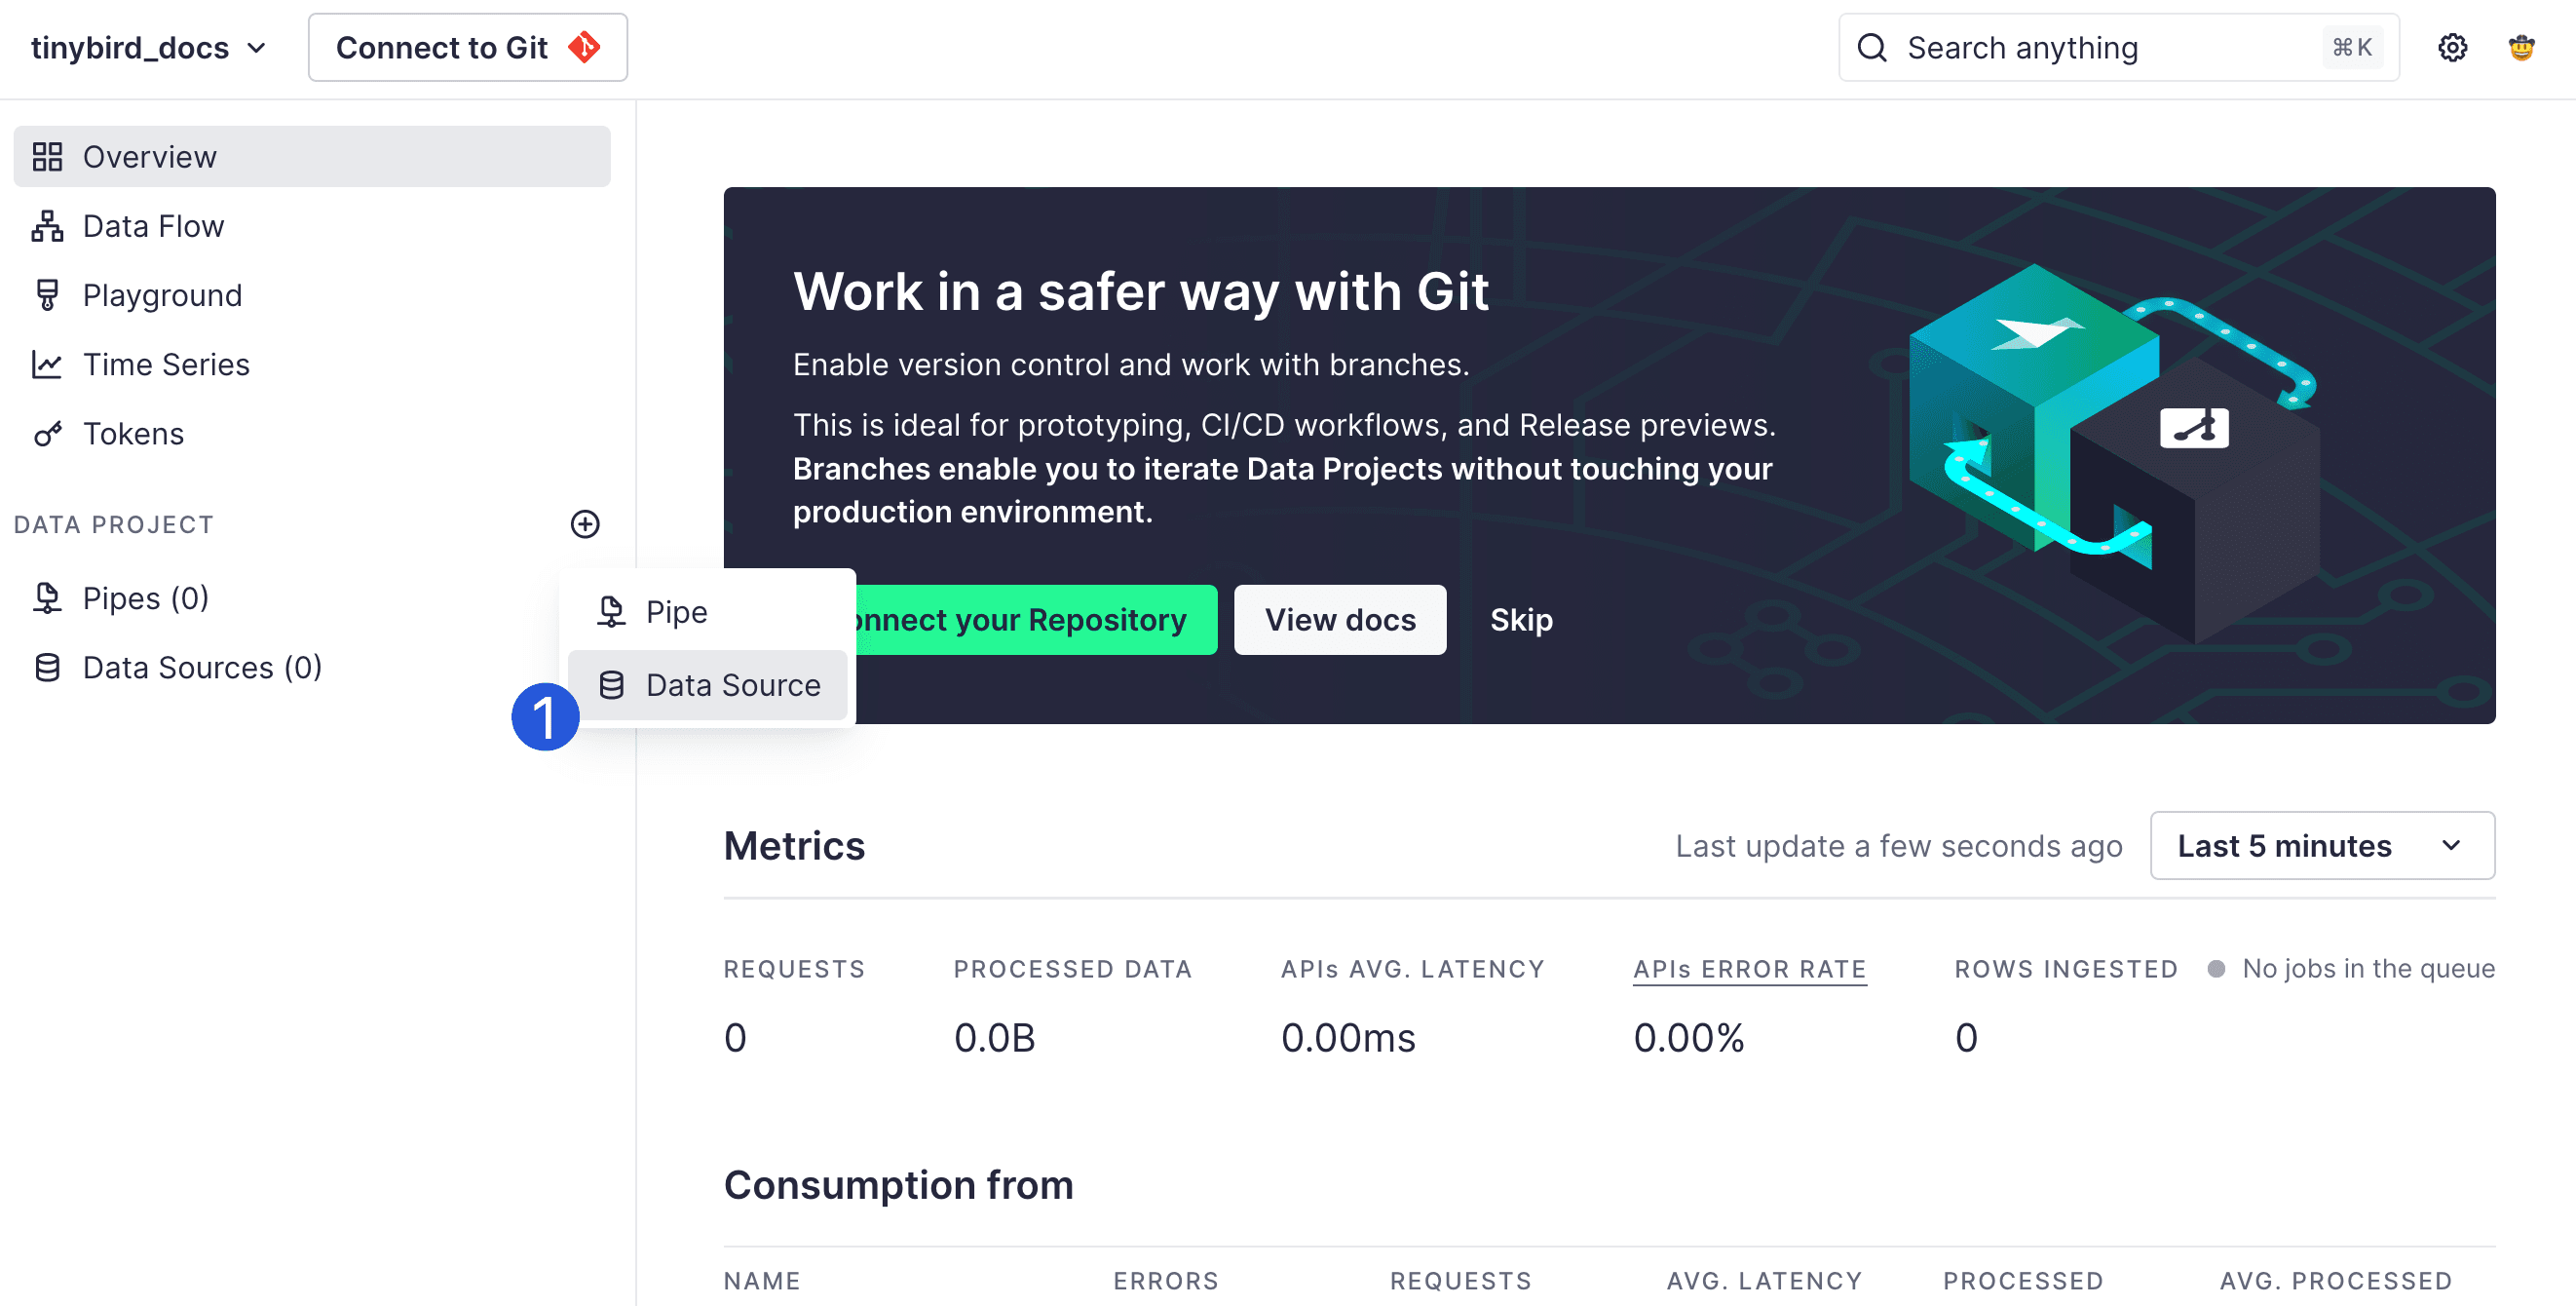
In your Workspace, find the Data Sources section at the bottom of the left side navigation.
Select the Plus (+) icon to add a new Data Source (see Mark 1 below).
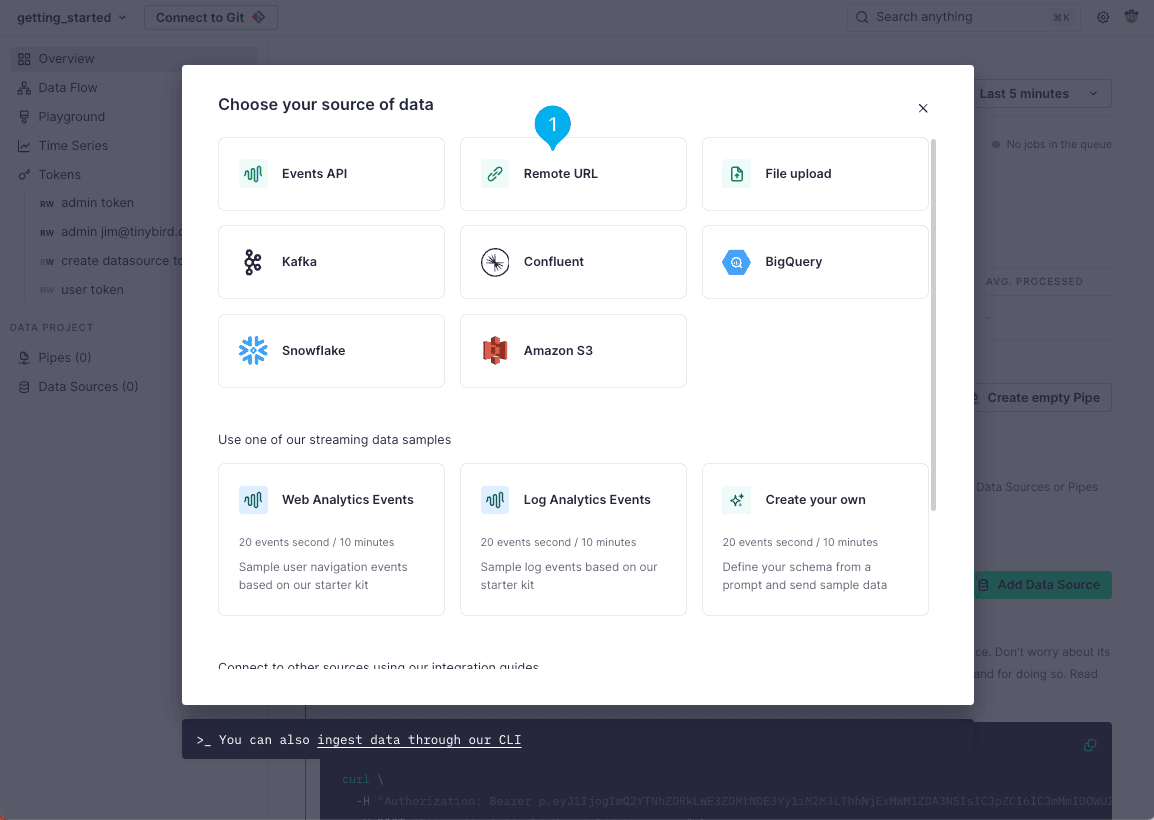
In the modal that opens, select the Remote URL connector (see Mark 1 below).
In the next window, ensure that csv is selected (see Mark 1 below), and then paste the following URL into the text box (see Mark 2 below).
https://storage.googleapis.com/tinybird-assets/datasets/guides/events_50M_1.csv
Finally, select the Add button to finish (see Mark 3 below).

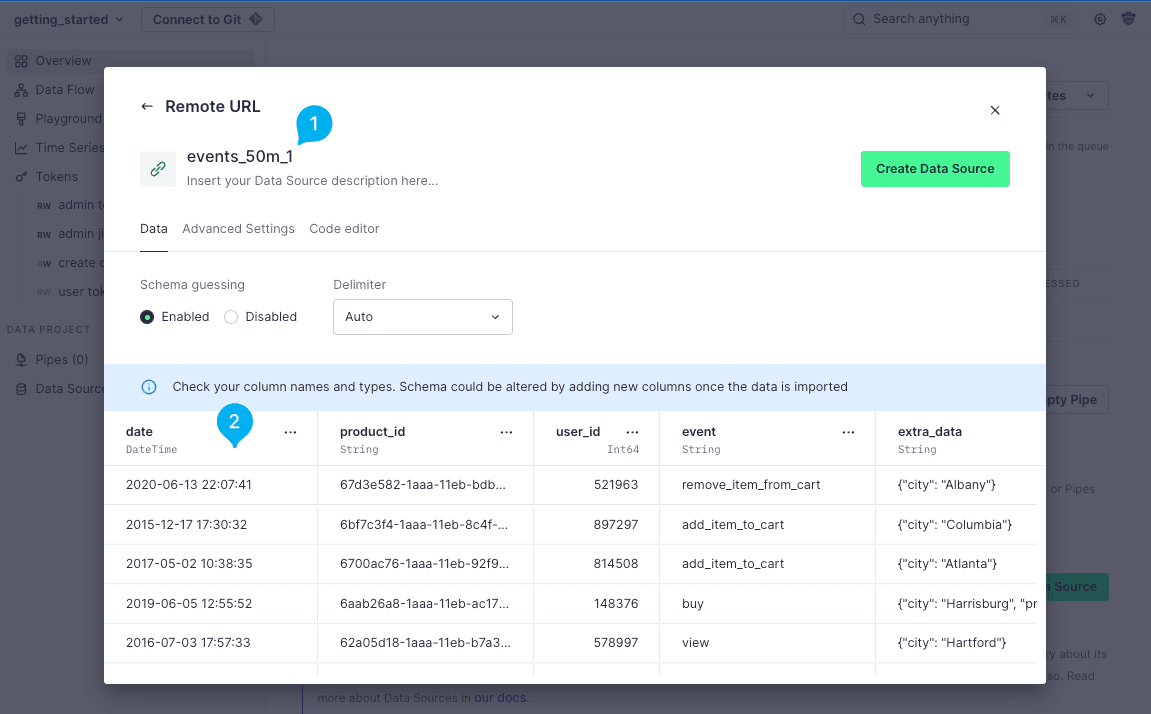
On the next screen, give the Data Source a name and description (see Mark 1 below). Tinybird also shows you a preview of the schema and data (see Mark 2 below).
Change the name to something more descriptive. Select the name field and enter the name shopping_data.
Start the data import
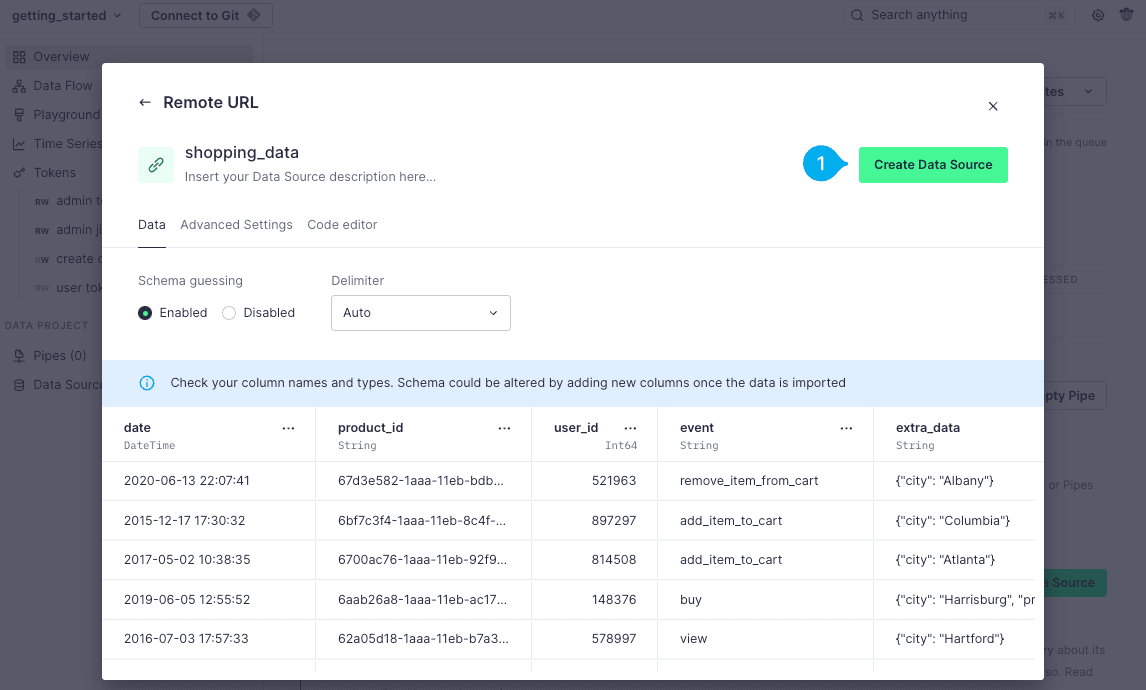
After setting the name of your first Data Source, select Create Data Source to start importing the data (see Mark 1 below).
Your Data Source has now been created in your Workspace. If it doesn't show up, refresh the window. Loading the data doesn't take very long, and you don't need to wait for it to finish. Your Workspace should look like this:
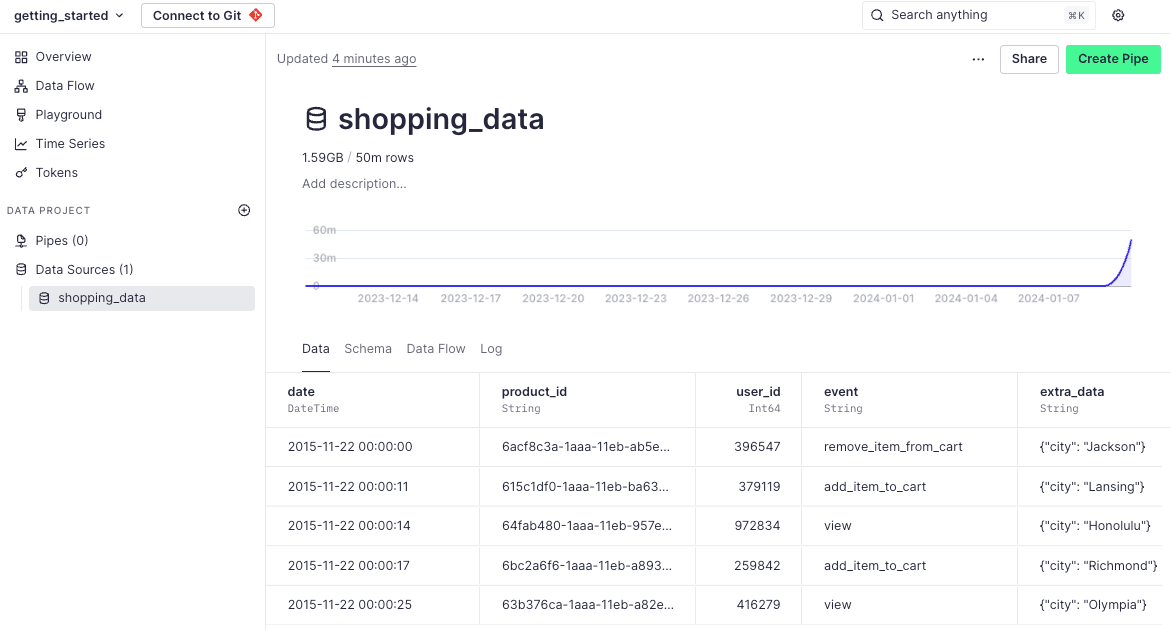
OK: You've ingested your data. Now, you can move on to creating your first Pipe!
2. Create a Pipe
In Tinybird, SQL queries are written inside Pipes. One Pipe can be made up of many individual SQL queries called nodes; each Node is a single SQL SELECT statement. A Node can query the output of another Node in the same Pipe. This means that you can break large queries down into a multiple smaller, more modular, queries and chain them together - making it much easier to build and maintain in the future.
Add the new Pipe
Add a new Pipe by selecting the Plus (+) icon next to the Pipes category in the left side navigation (see Mark 1 below).
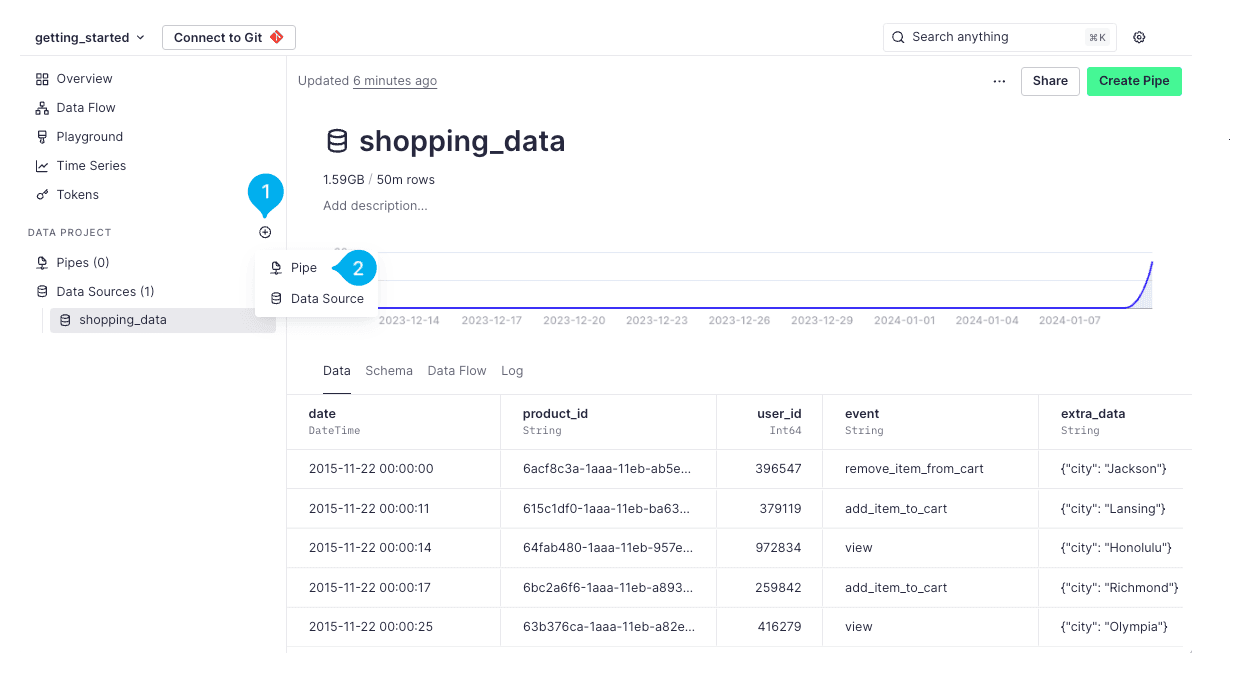
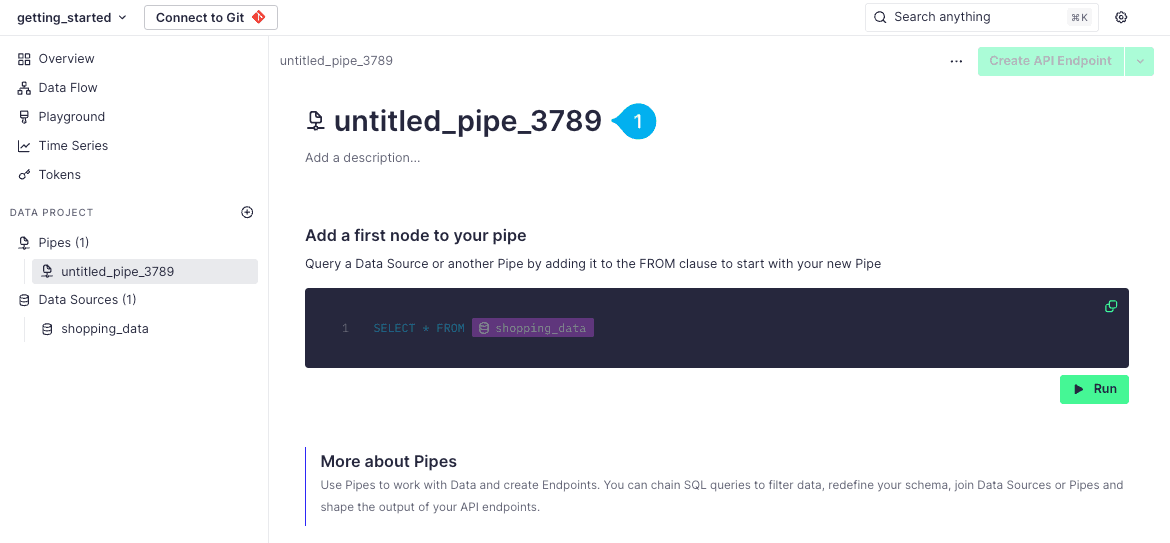
This adds a new Pipe with an auto-generated default name. Just like with a Data Source, you can select the name and description to change it (see Mark 1 below).
Call this Pipe top_10_searched_products.
Filter the data
At the top of your new Pipe is the first Node, which is pre-populated with a simple SELECT over the data in your Data Source (see Mark 1 below). Before you start modifying the query in the Node, select the Run button (see Mark 2 below).
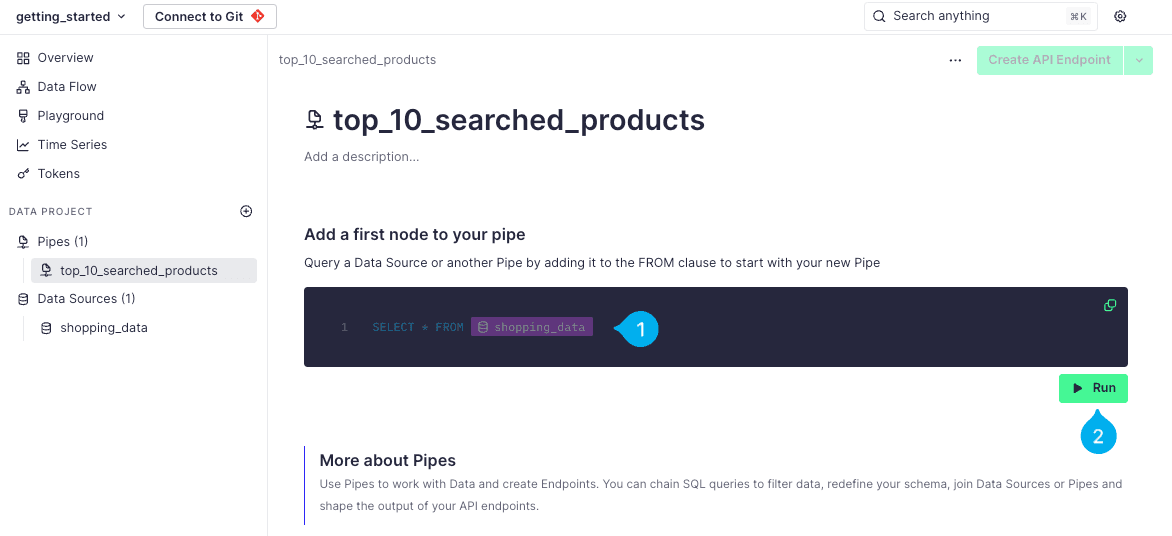
Hitting Run executes the query in the Node, and shows us a preview of the query result (see Mark 1 below). You can individually execute any Node in your Pipe to see the result, so it's a great way to check that your queries are generating the output you expect.
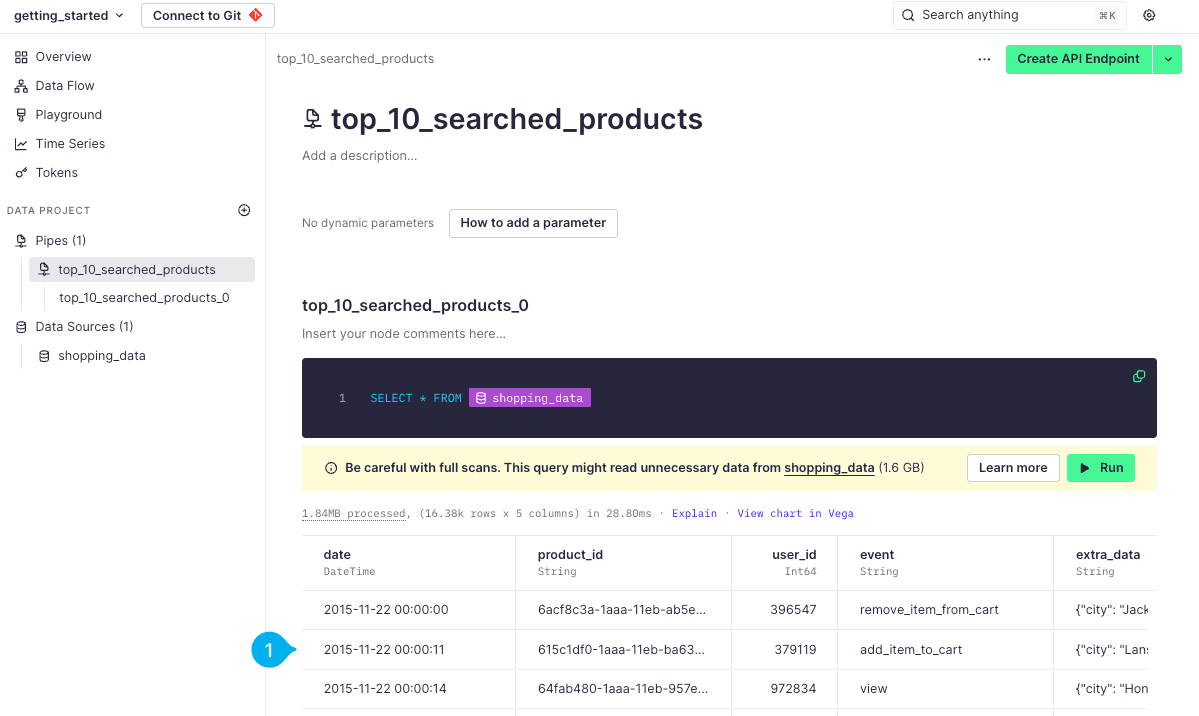
Now, you can modify the query to do something more interesting. In this Pipe, you want to create a list of the top 10 most searched products. If you take a look at the data, you will notice an event column, which describes what kind of event happened. This column has various values, including view, search, and buy. You are only interested in rows where the event is search, so modify the query to filter the rows.
Replace the Node SQL with the following query:
SELECT *
FROM shopping_data
WHERE event == 'search'
Select Run again when you are done updating the Node. This Node is now applying a filter to the data, so you only see the rows of interest.
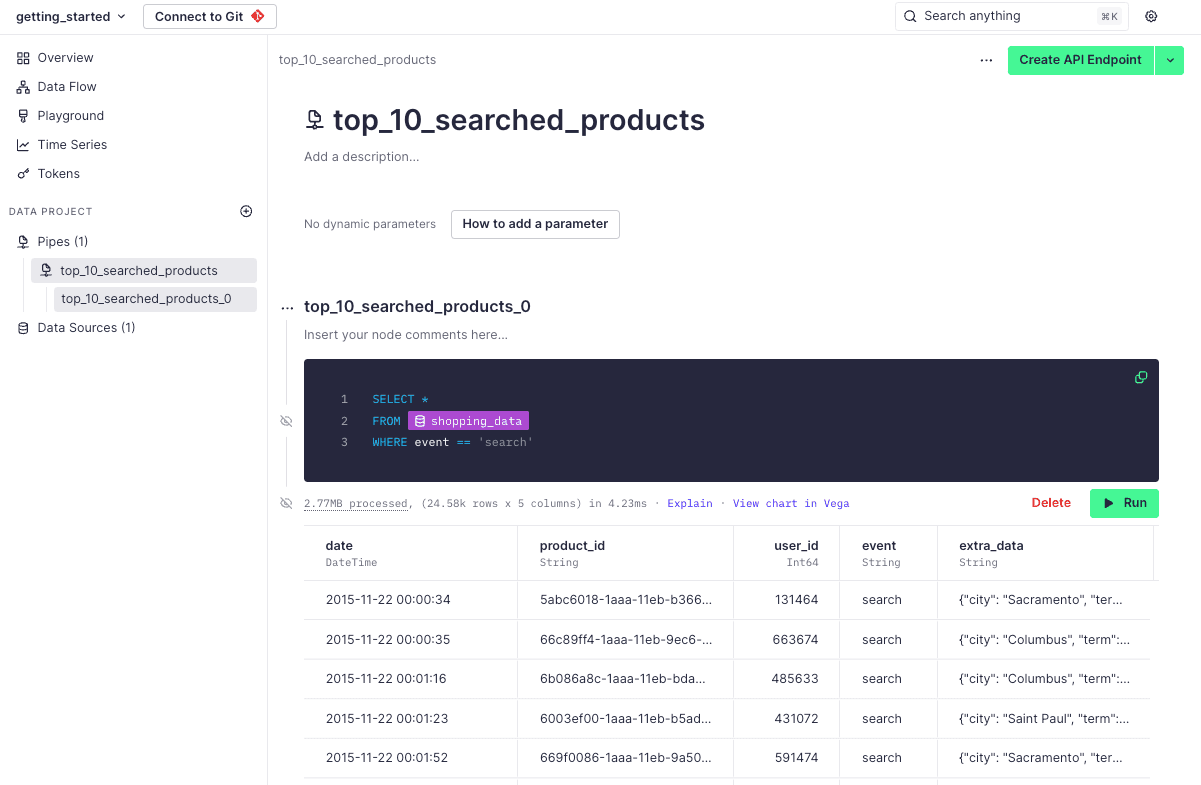
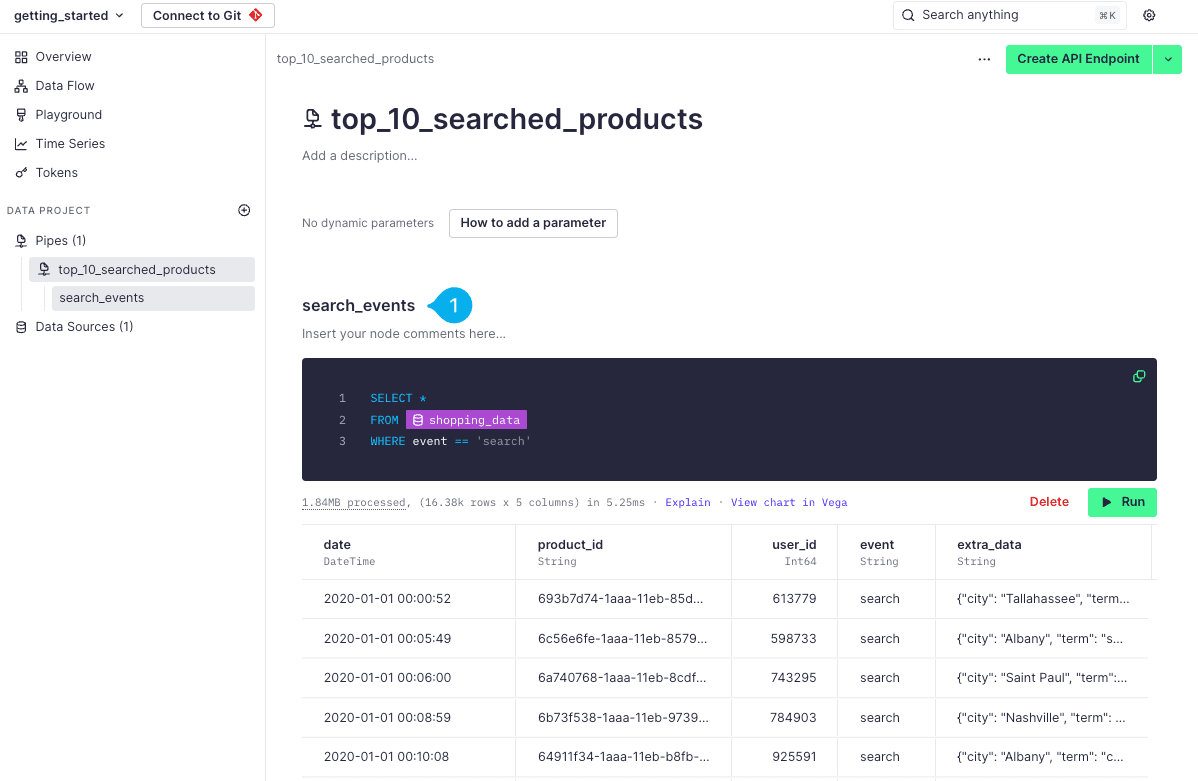
At the top of the Node, you will notice that it has been named after the Pipe. Just as before, you can rename the Node and give it a description, to help us remember what the Node is doing (see Mark 1 below).
Call this Node search_events.
Aggregate the data
Next, you want to work out how many times each individual product has been searched for. This means you are going to want to do a count and aggregate by the product id. To keep your queries more simple, create a second Node to do this aggregation.
Scroll down a little, and you will see a second Node is suggested at the bottom of the page (see Mark 1 below).
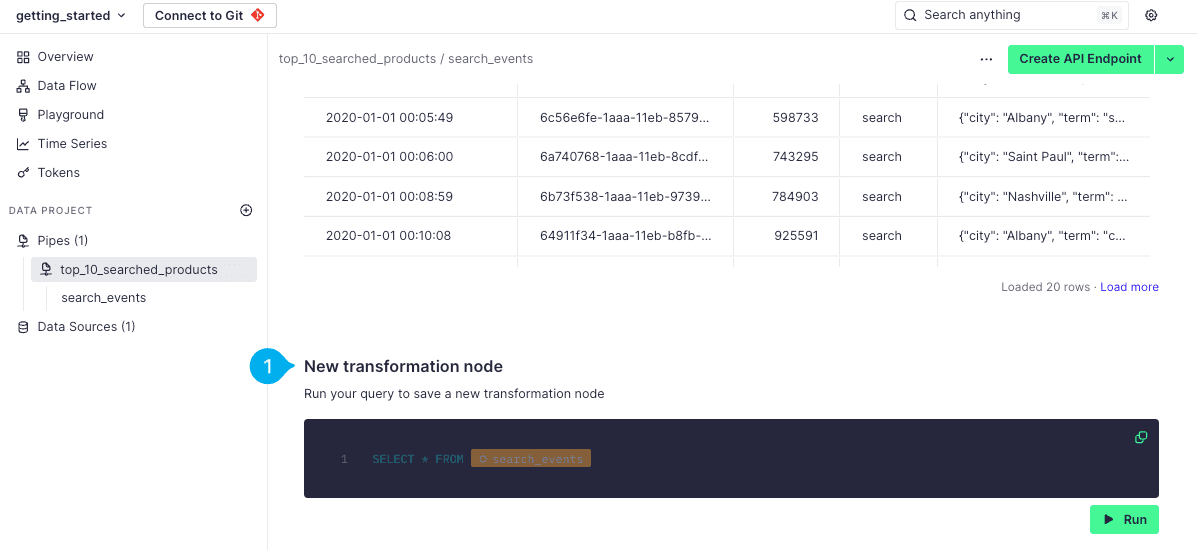
The really cool thing here is that this second Node can query the result of the search_events Node you just created. This means you don't need to duplicate the WHERE filter in this next query, as you are already querying the filtered rows in the previous Node.
Use the following query for the next Node:
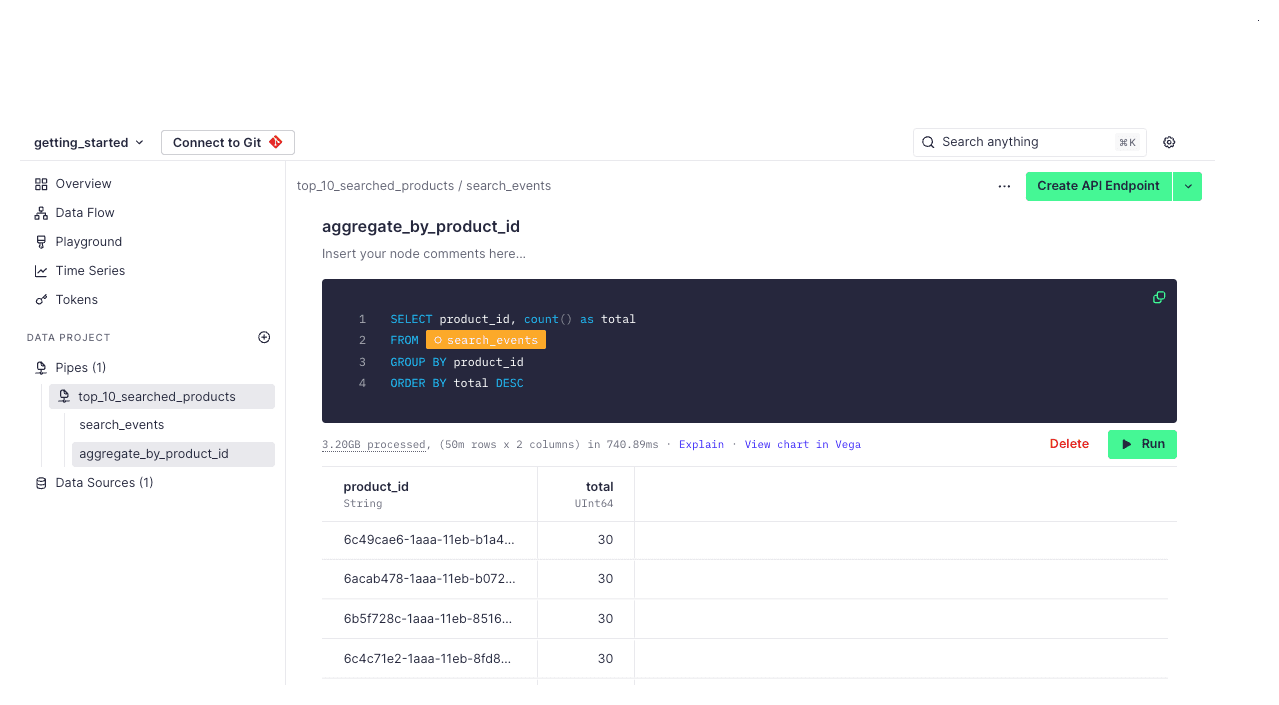
SELECT product_id, count() as total
FROM search_events
GROUP BY product_id
ORDER BY total DESC
Select Run again to see the results of the query.
Do not forget to rename this Node... Your future self will thank you! Call it aggregate_by_product_id.
Transform the result
Finally, create the last Node that you'll use to publish as a Tinybird API Endpoint and limit the results to the top 10 products.
Create a third Node and use the following query:
SELECT product_id, total
FROM aggregate_by_product_id
LIMIT 10
Just as before, you could theoretically name this Node whatever you want. However, as you'll publish it as an API Endpoint, follow the common convention to name this Node endpoint. When you get to the "Publish API Endpoint" step next, all your nodes are listed and the endpoint name makes it clear which one to select.
Select Run to preview the results.
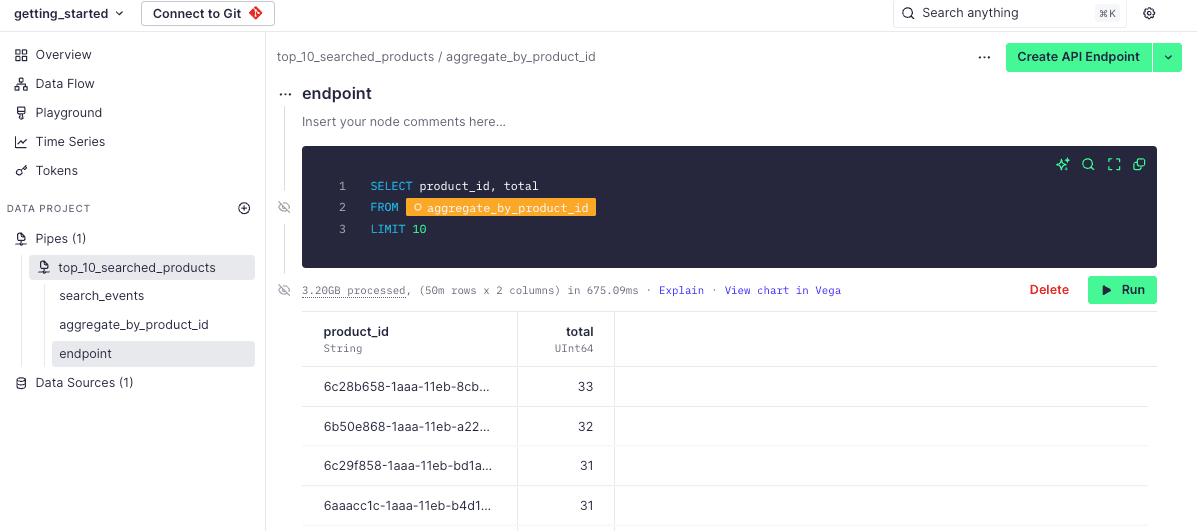
With that, you've built the logic required to query your ingested data and return the top 10 most searched products. Nice!
Top tip: Now you've got some Data Sources and Pipes, press ⌘+K or CTRL+K at any time in the Tinybird UI to open the Command Bar and view all those Workspace resources. No matter how many you build out in the future, you'll always have a quick way to navigate to them!
3. Publish and use your API Endpoint
Now, let's say you have an application that wants to be able to access and use this top 10 result. The magic of Tinybird is that you can choose any query and instantly publish the results as a RESTful API Endpoint. Applications can simply hit the API Endpoint and get the very latest results.
Publish the API Endpoint
At this point you encounter a core Tinybird object, the API Endpoint. Tinybird API Endpoints are published directly from selected nodes. API Endpoints come with an extensive feature set, including support for dynamic query parameters and auto-generated docs complete with code samples.
To publish a Node as an API Endpoint, select the Create API Endpoint button in the top right corner of the Workspace (see Mark 1 below). Then, select the Create API Endpoint option. You will then see a list of your nodes - select the endpoint Node (see Mark 2 below).
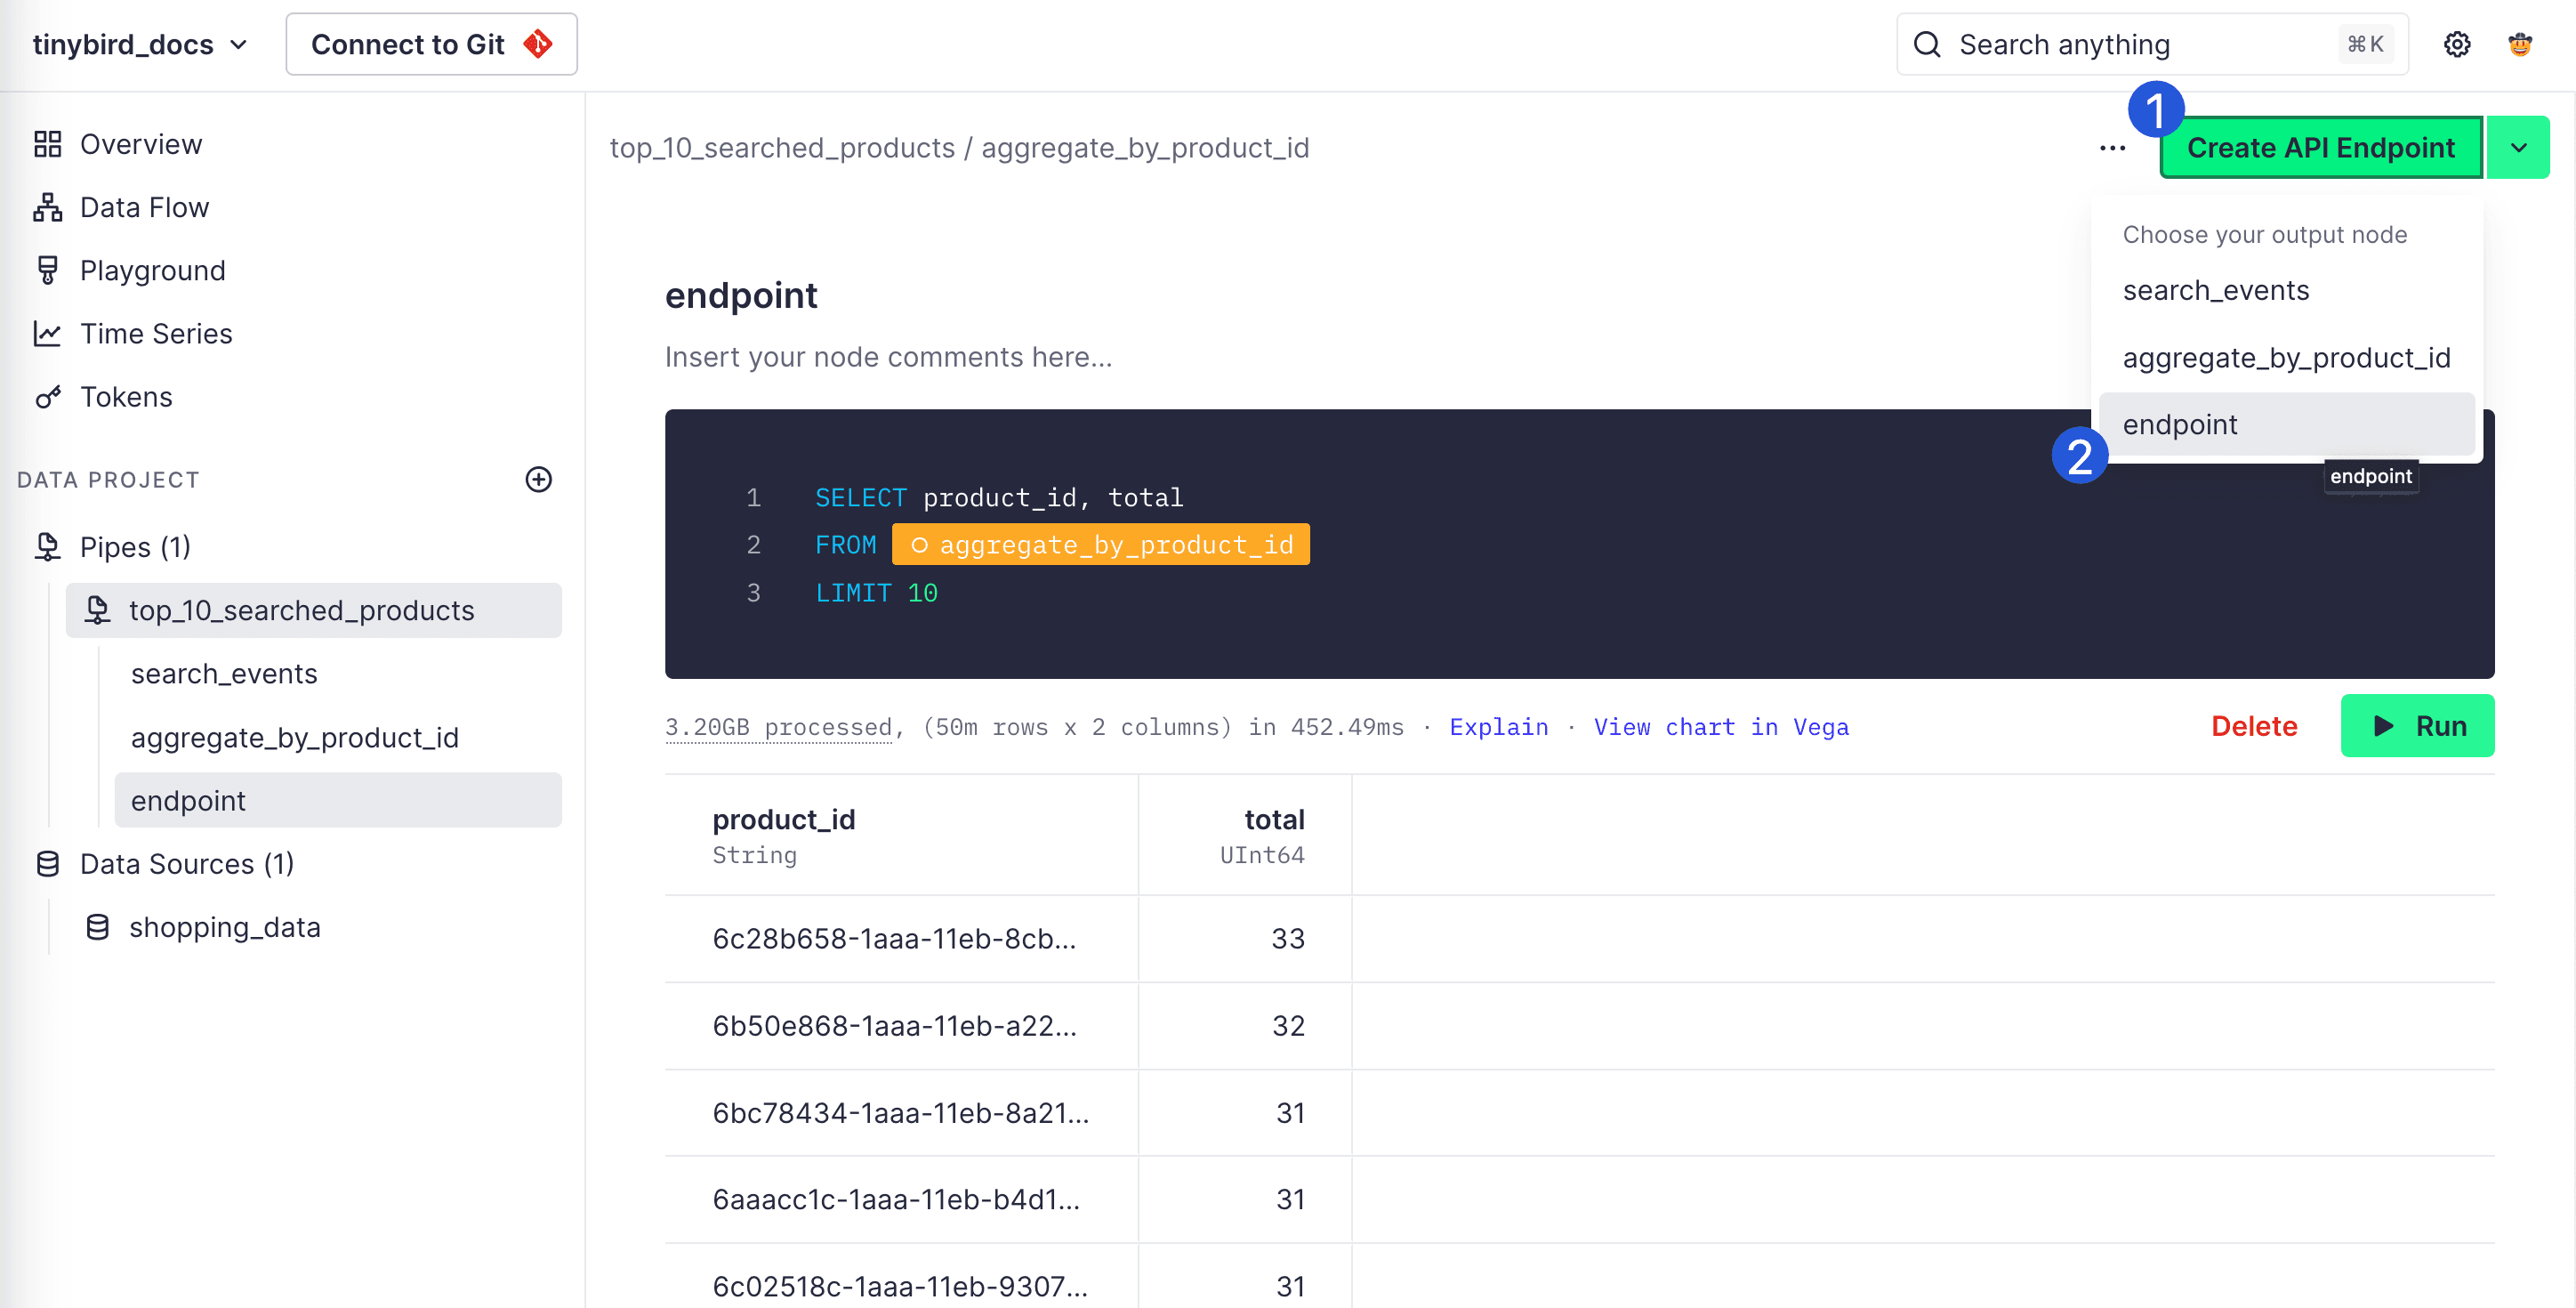
And now you have your very first API Endpoint! This page shows all the details about your new API Endpoint including observability charts, links to auto-generated API Endpoint documentation, and code snippets to help you integrate it with your application.
Test the API Endpoint
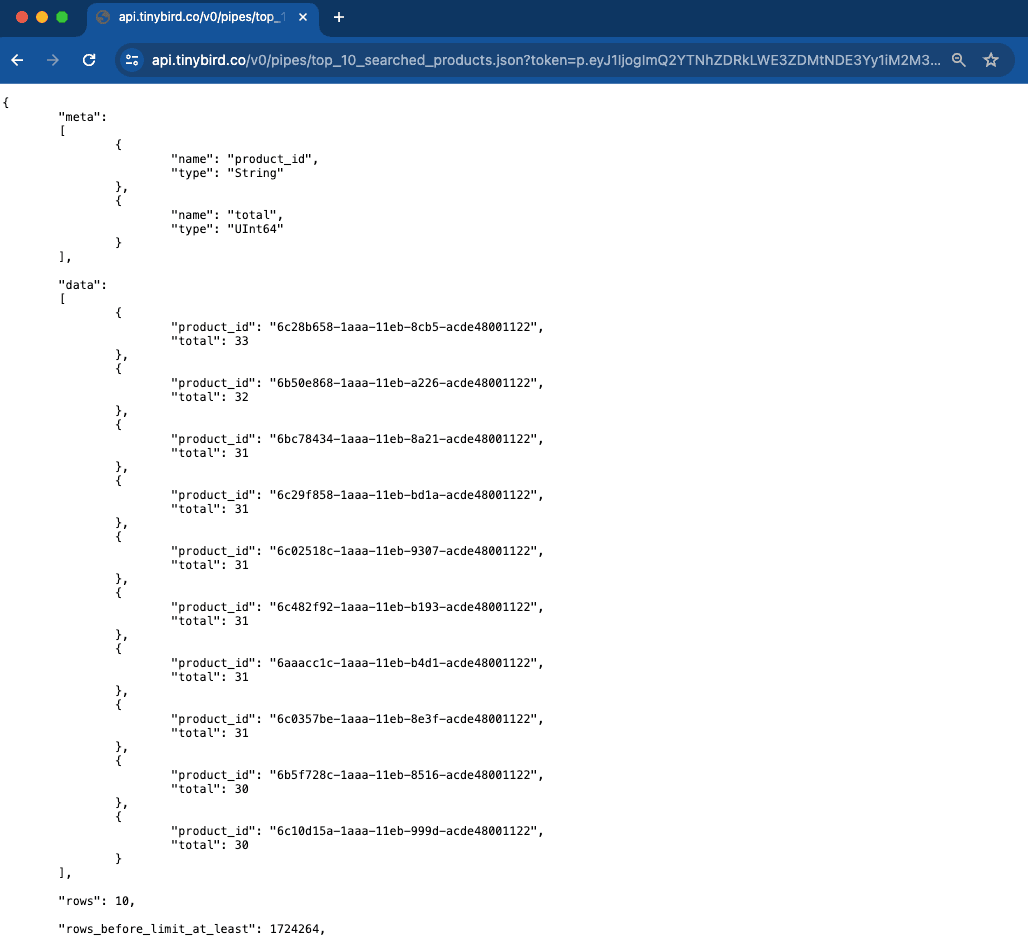
On your API overview page, scroll down to the Sample usage section, and copy the HTTP URL from the snippet box. Open this URL in a new tab in your browser.
Hitting the API Endpoint triggers your Pipe to execute, and you get a JSON formatted response with the results.
4. Build Charts showing your data
On your API overview page, select Create Chart (using the dropdown, you can also share the docs for this API Endpoint, too - see Mark 1 below):
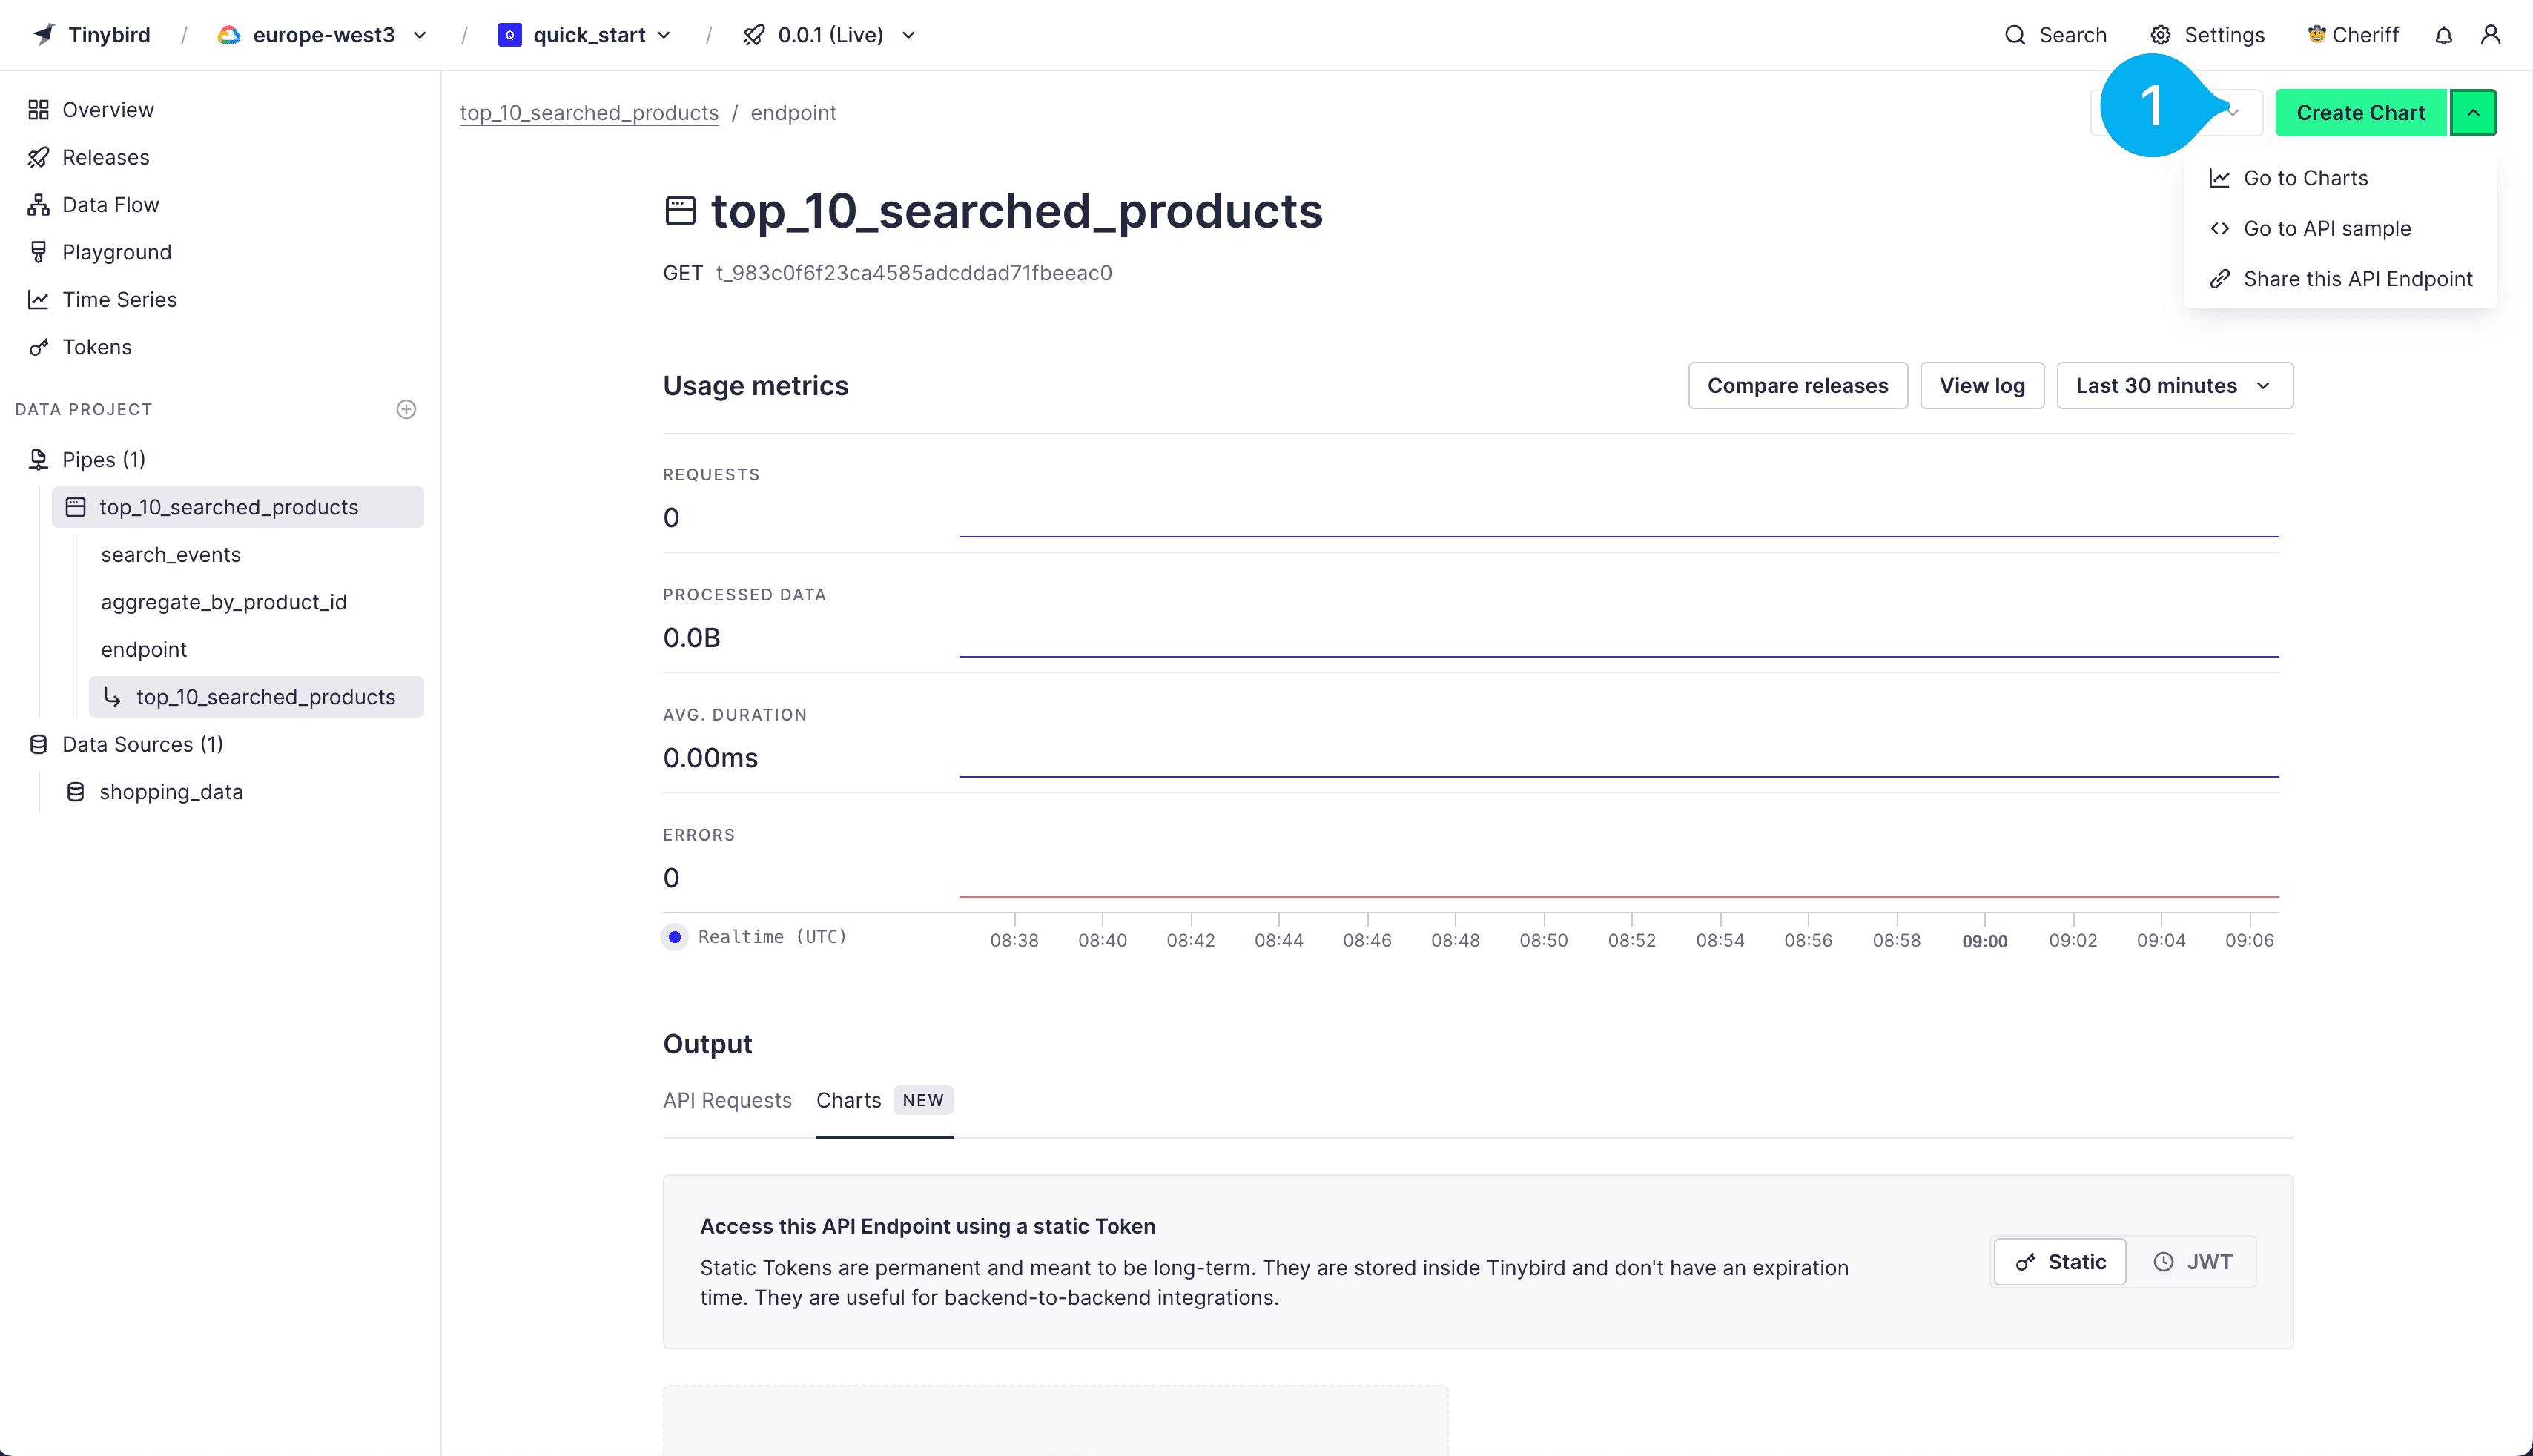
You can also build Charts to embed in your own application. See the Charts documentation for more.
Celebrate
Congrats! You have finished creating your first API Endpoint in Tinybird!
While working through these steps, you have accomplished a lot in just a few minutes. You have imported 50 million events, built a variety of queries with latencies measured in milliseconds, and stood up an API Endpoint that can serve thousands of concurrent requests.
Next steps
Import and build with your own data
Ready to start building with your own data? If you have a variety of data stores and sources, Tinybird is a great platform to unify them.
Tinybird provides built-in connectors to easily ingest data from Kafka, Confluent Cloud, Big Query, Amazon S3, and Snowflake. If you want to stream data over HTTP, you can send data directly to Tinybird's Events API with no additional infrastructure.
Using version control
This walkthrough covered the basics of Tinybird without integrating version control into the process. You're ready to take it to the next level! Head over to the version control overview.
Build Charts
Tinybird Charts make it easy to create interactive, customizable charts of your data. Read more about them in the Charts docs.