Build a real-time game leaderboard
In this guide you'll learn how to build a real-time leaderboard using Tinybird.
Leaderboards are a visual representation that ranks things by one or more attributes. For gaming use cases, commonly-displayed attributes include total points scored, high game scores, and number of games played.
But leaderboards are used for far more than games. For example, app developers use leaderboards to display miles biked, donations raised, documentation pages visited most often, and countless other examples - basically, anywhere there is some user attribute that can be ranked to compare results. This tutorial is a great starting point for building your own leaderboard.
GitHub Repository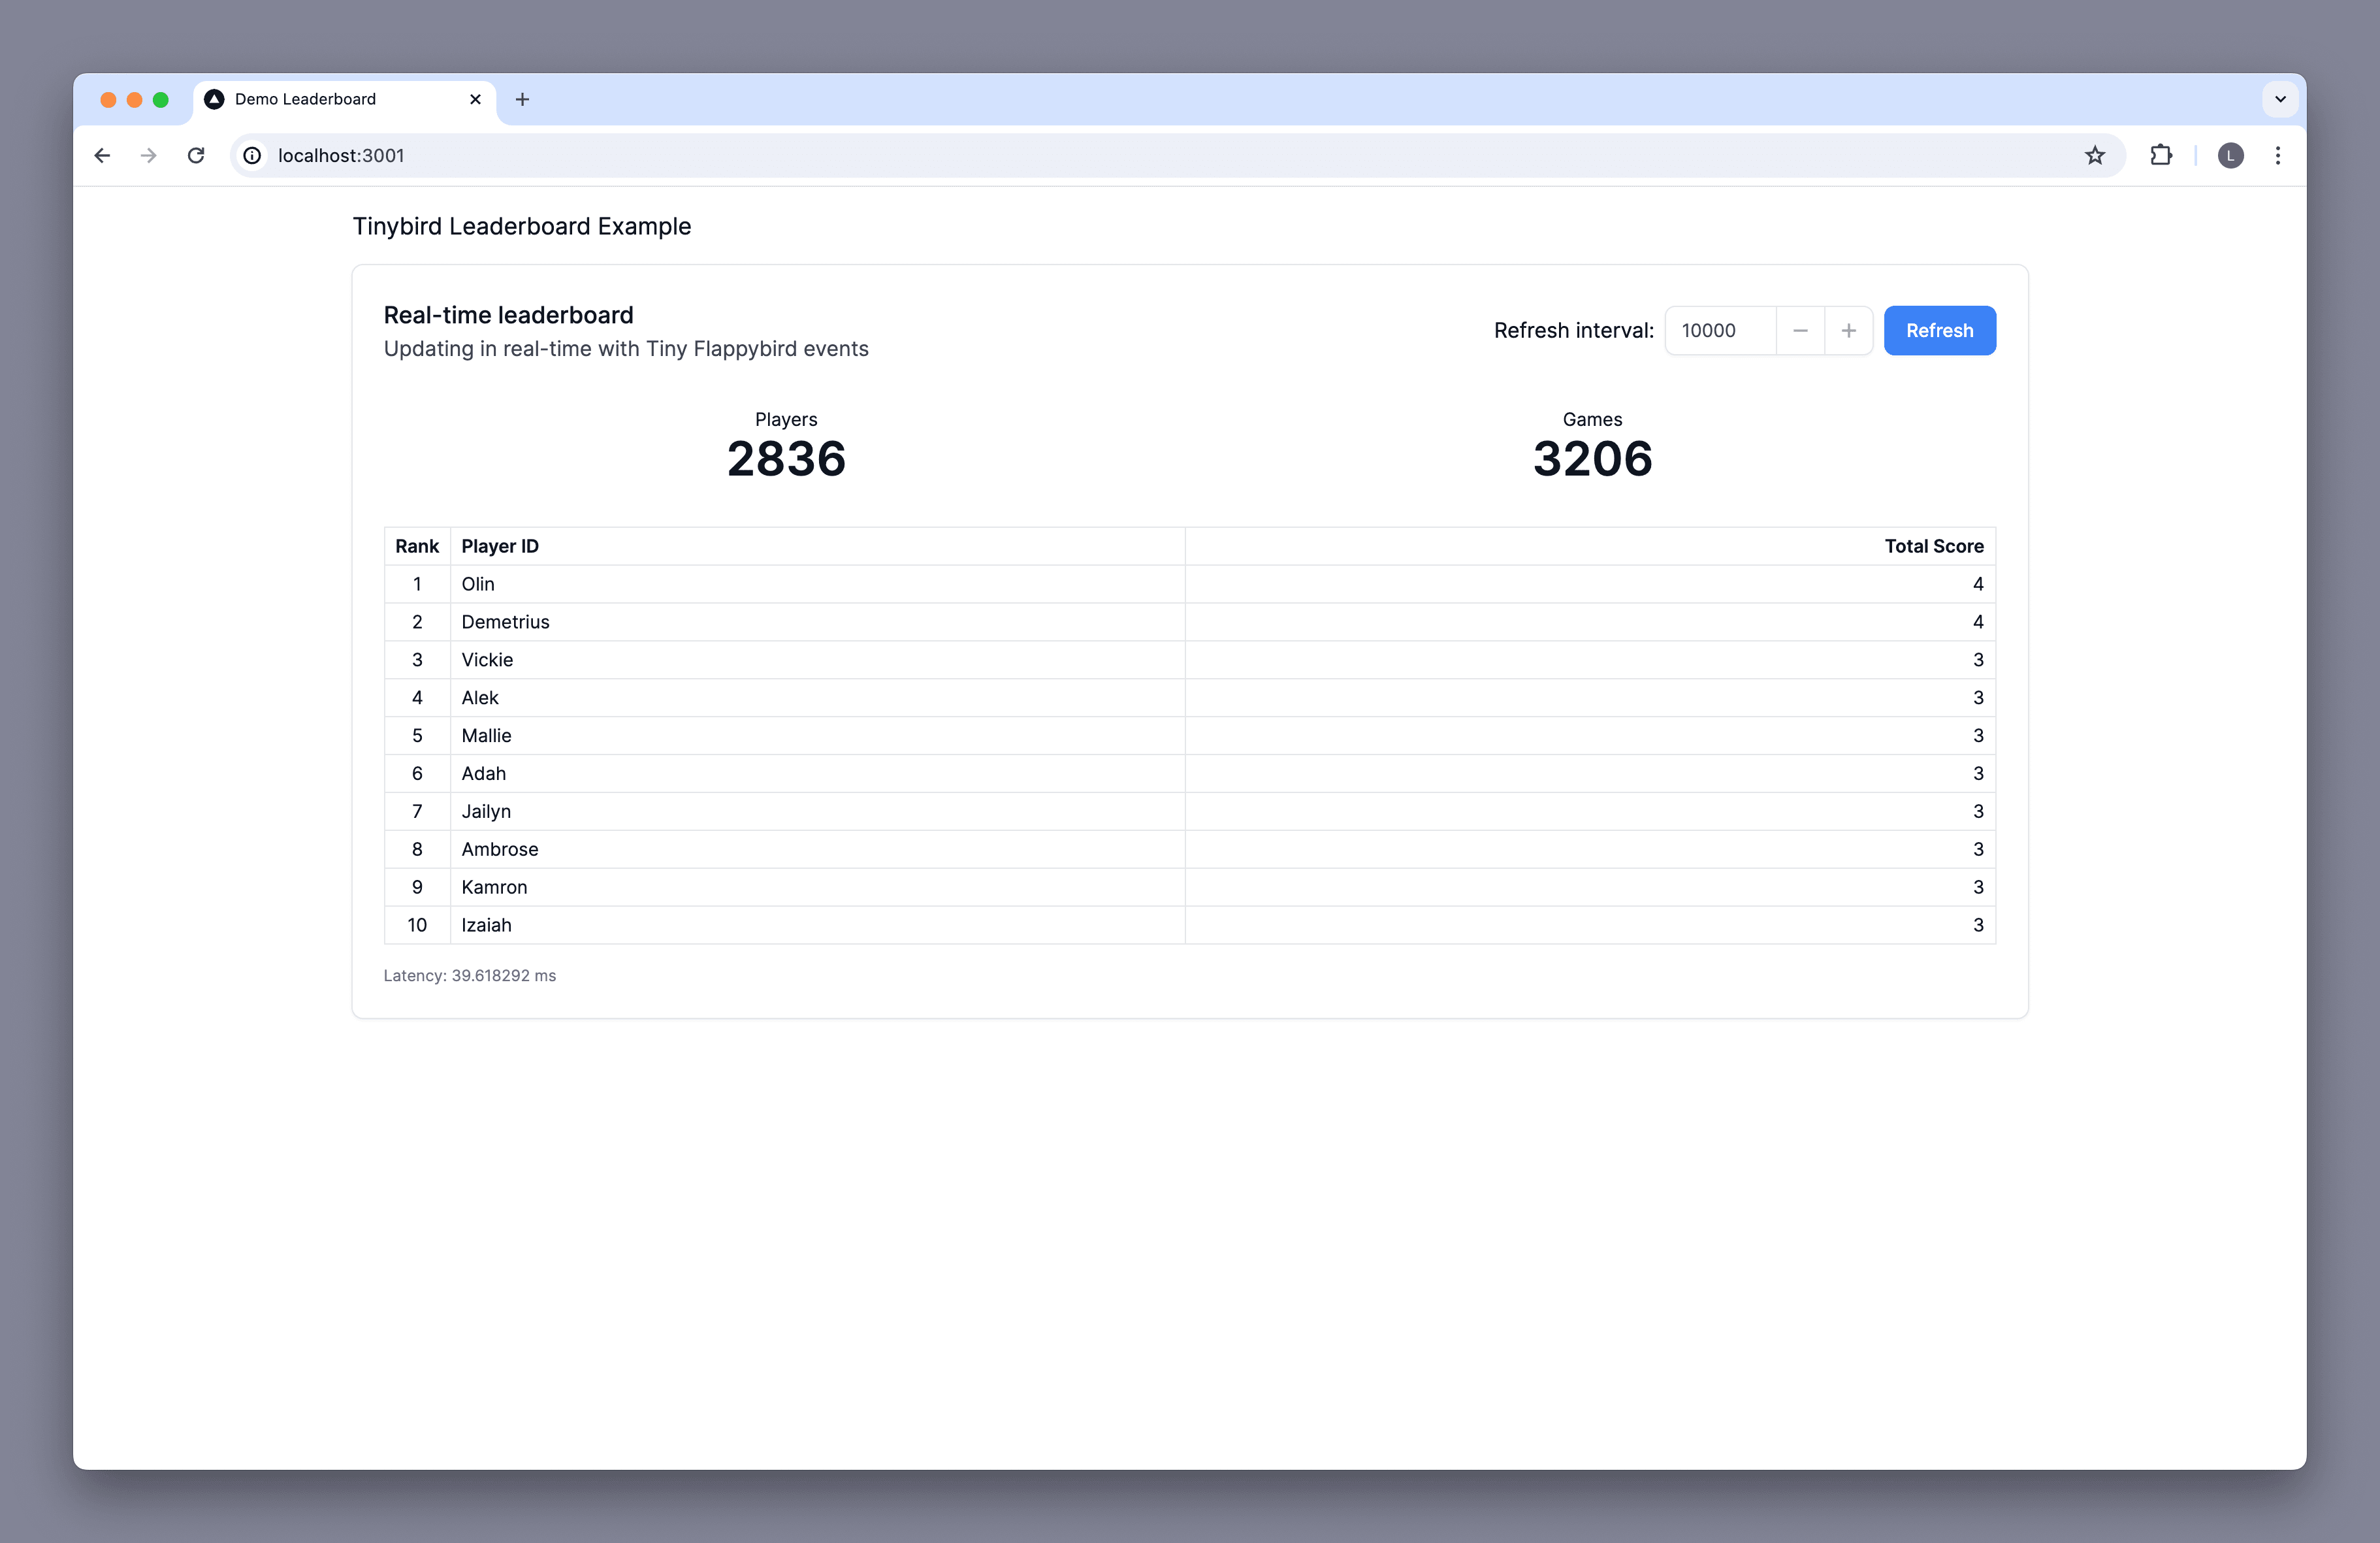
In this tutorial, you'll add a gaming leaderboard to the Flappybird game. Not only is this game fun to play, it's also a vehicle for demonstrating user-facing features. For example, the game features a leaderboard so you can see how your most recent score compares to other top players.
You will:
- Generate a mock game event stream that mimics a high-intensity Flappybird global tournament.
- Post these mock events to your Tinybird Workspace using the Events API.
- Transform (rank) this data using Tinybird Pipes and SQL.
- Optimize your data handling with a Materialized View.
- Publish the results as a Tinybird API Endpoint.
- Generate a leaderboard that makes calls to your API Endpoint securely and directly from the browser.
Each time a leaderboard request is made, up-to-the-second results are returned for the leaderboard app to render. When embedded in the game, a leaderboard API Endpoint is requested when a game ends. For this tutorial, the app will make requests on a specified interval and have a button for ad-hoc requests.
Game events consist of three values:
core- Generated when a point is scored.game_over- Generated when a game ends.purchase- Generated when a 'make-the-game-easier' coupon is redeemed.
Each event object has the following JSON structure:
Example JSON event object
{
    "session_id": "1f2c8bcf-8a5b-4eb1-90bf-8726e63d81b7",
    "name": "Marley",
    "timestamp": "2024-06-20T19:06:15.373Z",
    "type": "game_over",
    "event": "Mockingbird"
}
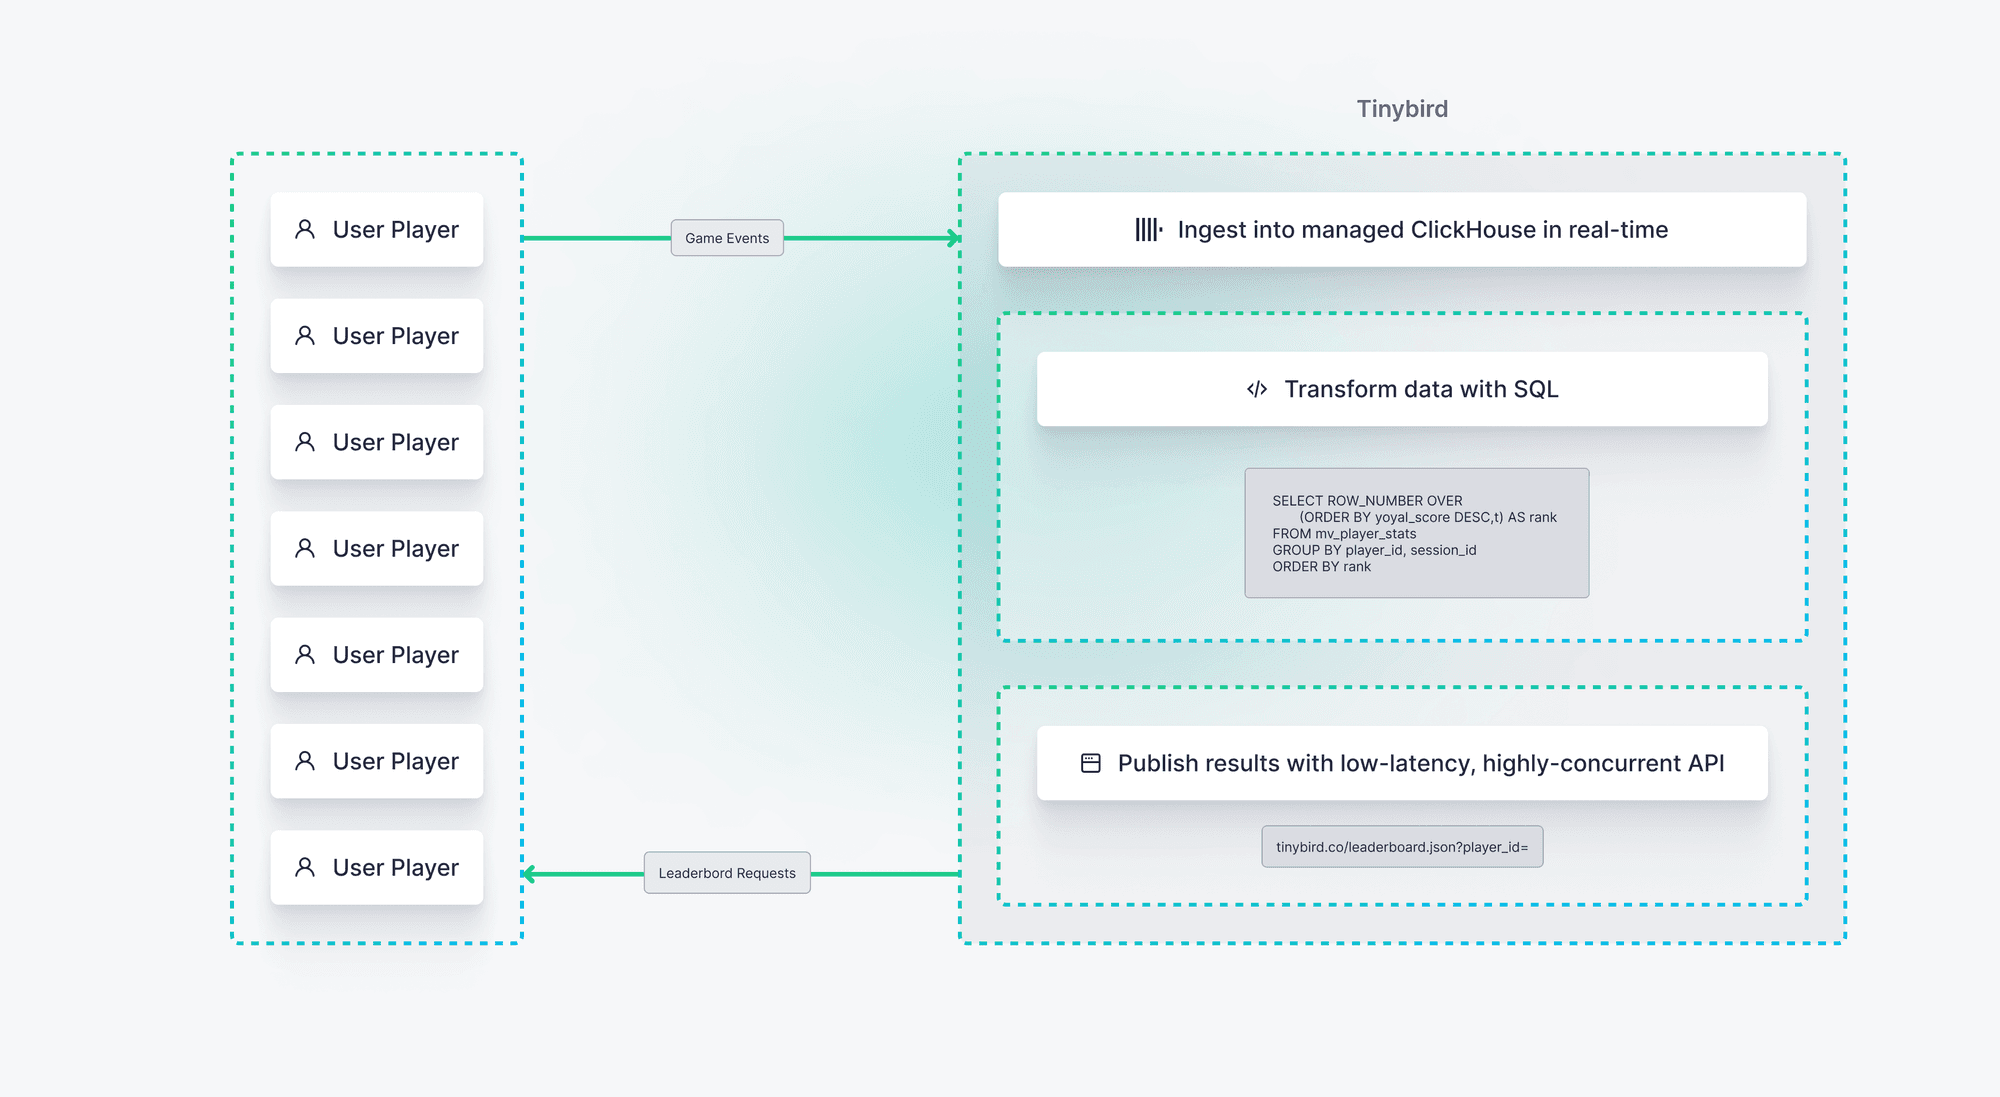
Here's how it all fits together:
Prerequisites
To complete this tutorial, you'll need the following:
- A free Tinybird account
- An empty Tinybird Workspace
- Node.js >=20.11
- Python >=3.8
1. Create a Tinybird Workspace
Navigate to the Tinybird web UI (app.tinybird.co) and create an empty Tinybird Workspace (no starter kit) called tiny_leaderboard in your preferred region.
Create a Data Source for events
The first step with any Tinybird project is to create Data Sources to work with. For this tutorial, you have two options. The first is to create a Data Source based on a schema that you define. The alternative is to rely on the Mockingbird tool used to stream mock data to create the Data Source for you. While the Mockingbird method is faster, building your own Data Source gives you more control and introduces some fundamental concepts along the way.
Option 1: Create a Data Source using a written schema
In the Tinybird UI, add a new Data Source and use the Write schema option. In the schema editor, use the following schema:
Data Source schema
SCHEMA >
    `name` String `json:$.name`,
    `session_id` String `json:$.session_id`,
    `timestamp` DateTime64(3) `json:$.timestamp`,
    `type` LowCardinality(String) `json:$.type`,
    `event` String `json:$.event`

ENGINE "MergeTree"
ENGINE_PARTITION_KEY "toYear(timestamp)"
ENGINE_SORTING_KEY "event, name, timestamp"
Name the Data Source game_events and select Create Data Source.
This schema definition shows how the incoming JSON events are parsed and assigned to each of schema fields. The definition also defines database table ‘engine’ details. Tinybird projects are made of Data Source and Pipe definition files like this example, and they can be managed like any other code project using Git.
Option 2: Create a Data Source with Mockingbird
As part of the Mockingbird configuration (see below), you'll provide the name of the Data Source to write the events to. If that Data Source does not already exist, a new Data Source with that name will be created with an automatically-generated schema. This auto-inferred schema may match your expectations, but it may lack important features. For example, automatically-generated schema will not apply the LowCardinality operator, a commonly-used operator that can make data lookups more efficient.
Having Mockingbird auto-create your exploratory Data Source is a great way to explore Tinybird. As you begin to prototype and design production systems, you should anticipate creating new Data Sources by providing a schema design.
Now you've created your main Data Source, it's ready to receive events!
2. Create a mock data stream
In a real-life scenario, you'd stream your game events into the game_events Data Source. For this tutorial, you'll use Mockingbird, an open source mock data stream generator, to stream mock events instead. Mockingbird generates a JSON payload based on a predefined schema and posts it to the Tinybird Events API, which then writes the data to your Data Source.
Generate fake data
Use this Mockingbird link to generate fake data for the game_events Data Source. Using this link ^ provides a pre-configured schema.
Enter your Workspace admin Token and select the Host region that matches your Workspace region. Select Save, then scroll down and select Start Generating!.
Replace the Tinybird API hostname or region with the API region that matches your Workspace.
In the Tinybird UI, confirm that the game_events Data Source is successfully receiving data.
Leaderboards typically leverage a concise data schema with just a user/item name, the ranked attribute, and a timestamp. This tutorial is based on this schema:
nameStringsession_idStringtimestampDateTime64(3)typeLowCardinality(String)eventString
Ranking algorithms can be based on a single score, time-based metrics, or weighted combinations of factors.
3. Transform and publish your data
Your Data Source is collecting events, so now it's time to create some Pipes. Pipes are made up of chained, reusable SQL Nodes and form the logic that will rank the results.
You'll start by creating a leaderboard Pipe with two Nodes. The first Node will return all 'score' events. The second Node will take those results and count these events by player and session (which defines a single game), and return the top 10 results.
Create a Pipe
In the Tinybird UI, create a new Pipe called leaderboard. To begin with, you'll use some basic SQL that isn't fully optimized, and that's ok! You'll optimize it later.
Paste in the following SQL and rename the first Node get_all_scores:
get_all_scores Node
%
SELECT name AS player_id, timestamp, session_id, event
FROM game_events
WHERE
    type = 'score'
    AND event == {{ String(event_param, 'Mockingbird', description="Event to filter on") }}
This query returns all events where the type is score.
Note that this Node creates a query parameter named event_param using the Tinybird templating syntax. This instance of Flappybird supports an ‘event’ attribute that supports organizing players, games, and events into separate groups. As shown above, incoming Mockingbird game events have a "event": "Mockingbird" attribute.
Select "Run" and add a new Node underneath, called endpoint. Paste in:
endpoint Node
SELECT player_id,
  session_id,
  event,
  count() AS score
FROM get_all_scores
GROUP BY player_id, session_id, event
ORDER BY score DESC
LIMIT 10
Select "Run", then select "Create API Endpoint". Congrats! Your data is now ranked, published, and available for consuming.
4. Optimize with Materialized Views
Before you run the frontend for your leaderboard, there are a few optimizations to make. Even with small datasets, it's a great habit to get into.
Materialized Views are updated as data is ingested, and create intermediate states that are merged with already-processed data. This ability to keep track of already-processed data, and combine it with recently arrived data, helps keep your API Endpoints performance super efficient. The Materialized View (MV) continuously re-evaluates queries as new events are inserted, reducing both latency and processed-data-per-query. In this case, the MV you create will pre-calculate the top scores, and merge those with recently-received events. This significantly improves query performance by reducing the amount of data that needs to be processed for each leaderboard request.
To create a new Materialized View, begin by adding a new Pipe and call it user_stats_mv. Then paste the following SQL into the first Node:
SELECT
    event,
    name AS player_id,
    session_id,
    countIfState(type = 'score') AS scores,
    countIfState(type = 'game_over') AS games,
    countIfState(type = 'purchase') AS purchases,
    minState(timestamp) AS start_ts,
    maxState(timestamp) AS end_ts
FROM games_events
GROUP BY
    event,
    player_id,
    session_id
This query relies on the countIfState function, which includes the -State operator to maintain immediate states containing recent data. When triggered by a -Merge operator (see below), these intermediate states are combined with the pre-calculated data. The countIfState function is used to maintain counts of each type of game event.
Name this Node populate_mv, then publish it as a Materialized View. Name your Materialized View user_stats.
You now have a new Data Source called user_stats, which is a Materialized View that is continuously updated with the latest game events.
As you will see next, the -State modifier that maintains intermediate states as new data arrives will be paired with a -Merge modifier in Pipes that pull from the user_stats Data Source.
5. Update leaderboard Pipe
Now that user_stats is available, you will now rebuild the leaderboard Pipe to take advantage of this more efficient Data Source. This step will help prepare your leaderboard feature to handle massive amounts of game events while serving requests to thousands of users.
The updated leaderboard Pipe will consist of three Nodes:
rank_games- Applies the countMerge( scores) function to get the current total from the user_stats Data Source.last_game- Retrieves the score from the player's most recent game and determines the player's rank.endpoint- Combines the results of these two Nodes and ranks by score.
Note that the last_game Node introduces the user-facing aspect of the leaderboard. As seen below, this Node retrieves a specific user's data and blends it into the leaderboard results.
To get started, update the leaderboard Pipe to use the user_stats Materialized View.
Return to the leaderboard Pipe and un-publish it.
Now, change the name of the first Node to rank_games and update the SQL to:
rank_games Node
%
SELECT
    ROW_NUMBER() OVER (ORDER BY total_score DESC, t) AS rank,
    player_id,
    session_id,
    countMerge(scores) AS total_score,
    maxMerge(end_ts) AS t
FROM user_stats
GROUP BY player_id, session_id
ORDER BY rank
A few things to notice here:
- The
rank_gamesNode now uses theuser_statsMaterialized View instead of thegame_eventsData Source. - The use of the
countMerge(scores)function. The-Mergeoperator triggers the MV-baseduser_statsData Source to combine any intermediate states with the pre-calculated data and return the results. - The use of the
ROW_NUMBER()window function that returns a ranking of top scores. These rankings are based on the merged scores (aliased astotal_scores) retrieved from theuser_statsData Source.
Next, change the name of the second Node to last_game and update the SQL to:
last_game Node
%
SELECT
    argMax(rank, t) AS rank,
    player_id,
    argMax(session_id, t) AS session_id,
    argMax(total_score, t) AS total_score
FROM rank_games
WHERE
    player_id = {{ String(player_id, 'Jim', description="Player to filter on", required=True) }}
GROUP BY player_id
This query returns the highest rank of a specified player and introduces a player_id query parameter.
To combine these results, add a new Node called endpoint and paste the following SQL:
endpoint Node
SELECT *
FROM
    (
        SELECT rank, player_id, session_id, total_score
        FROM rank_games
        WHERE (player_id, session_id) NOT IN (SELECT player_id, session_id FROM last_game)
        LIMIT 10
        UNION ALL
        SELECT rank, player_id, session_id, total_score
        FROM last_game
    )
ORDER BY rank ASC
This query applies the UNION ALL statement to combine the two result sets. Note that the selected attribute data types must match to be combined.
This completes the leaderboard Pipe. Publish it as an API Endpoint.
Now that the final version of the 'leaderboard' Endpoint has been published, create one last Pipe in the UI. This one gets the overall stats for the leaderboard, the number of players and completed games. Name the Pipe get_stats and create a single Node named endpoint:
endpoint Node in the get_stats Pipe
WITH player_count AS (
  SELECT COUNT(DISTINCT player_id) AS players
  FROM user_stats
),
game_count AS (
  SELECT COUNT(*) AS games
  FROM game_events
  WHERE type == 'game_over'
)
SELECT players, games
FROM player_count, game_count
Publish this Node as an API Endpoint. You're ready to get it all running!
6. Run your app
Clone the demo-user-facing-leaderboard repo locally.
Install the app dependencies by running this command from the app dir of the cloned repo:
npm install
Add your Tinybird settings as environment variables
Create a new .env.local file:
touch .env.local
Copy your Tinybird Admin Token, Workspace UUID (Workspace > Settings > Advanced settings > ...), and API host url from your Tinybird Workspace into the new .env.local:
TINYBIRD_SIGNING_TOKEN="YOUR SIGNING TOKEN" # Use your Admin Token as the signing token
TINYBIRD_WORKSPACE="YOUR WORKSPACE ID" # The UUID of your Workspace
NEXT_PUBLIC_TINYBIRD_HOST="YOUR TINYBIRD API HOST e.g. https://api.tinybird.co" # Your regional API host
Replace the Tinybird API hostname or region with the API region that matches your Workspace.
Run your app
Run your app locally and navigate to http://localhost:3000:
npm run dev
Congrats! You now have an optimized gaming leaderboard ingesting real-time data! Have a think about how you'd adapt or extend it for your own use case.
Next steps
- Read the in-depth blog post on building a real-time leaderboard.
- Understand today's real-time analytics landscape with Tinybird's definitive guide.
- Learn how to implement multi-tenant security in your user-facing analytics.