Consume API Endpoints in Grafana
Grafana is an awesome open source analytics & monitoring tool. In this guide, you'll learn how to create Grafana Dashboards and Alerts consuming Tinybird API Endpoints.
Prerequisites
This guide assumes you have a Tinybird Workspace with an active Data Source, Pipes, and at least one API Endpoint. You'll also need a Grafana account.
1. Install the Infinity plugin
Follow the steps in Grafana Infinity plugin installation.
2. Create a Grafana data source
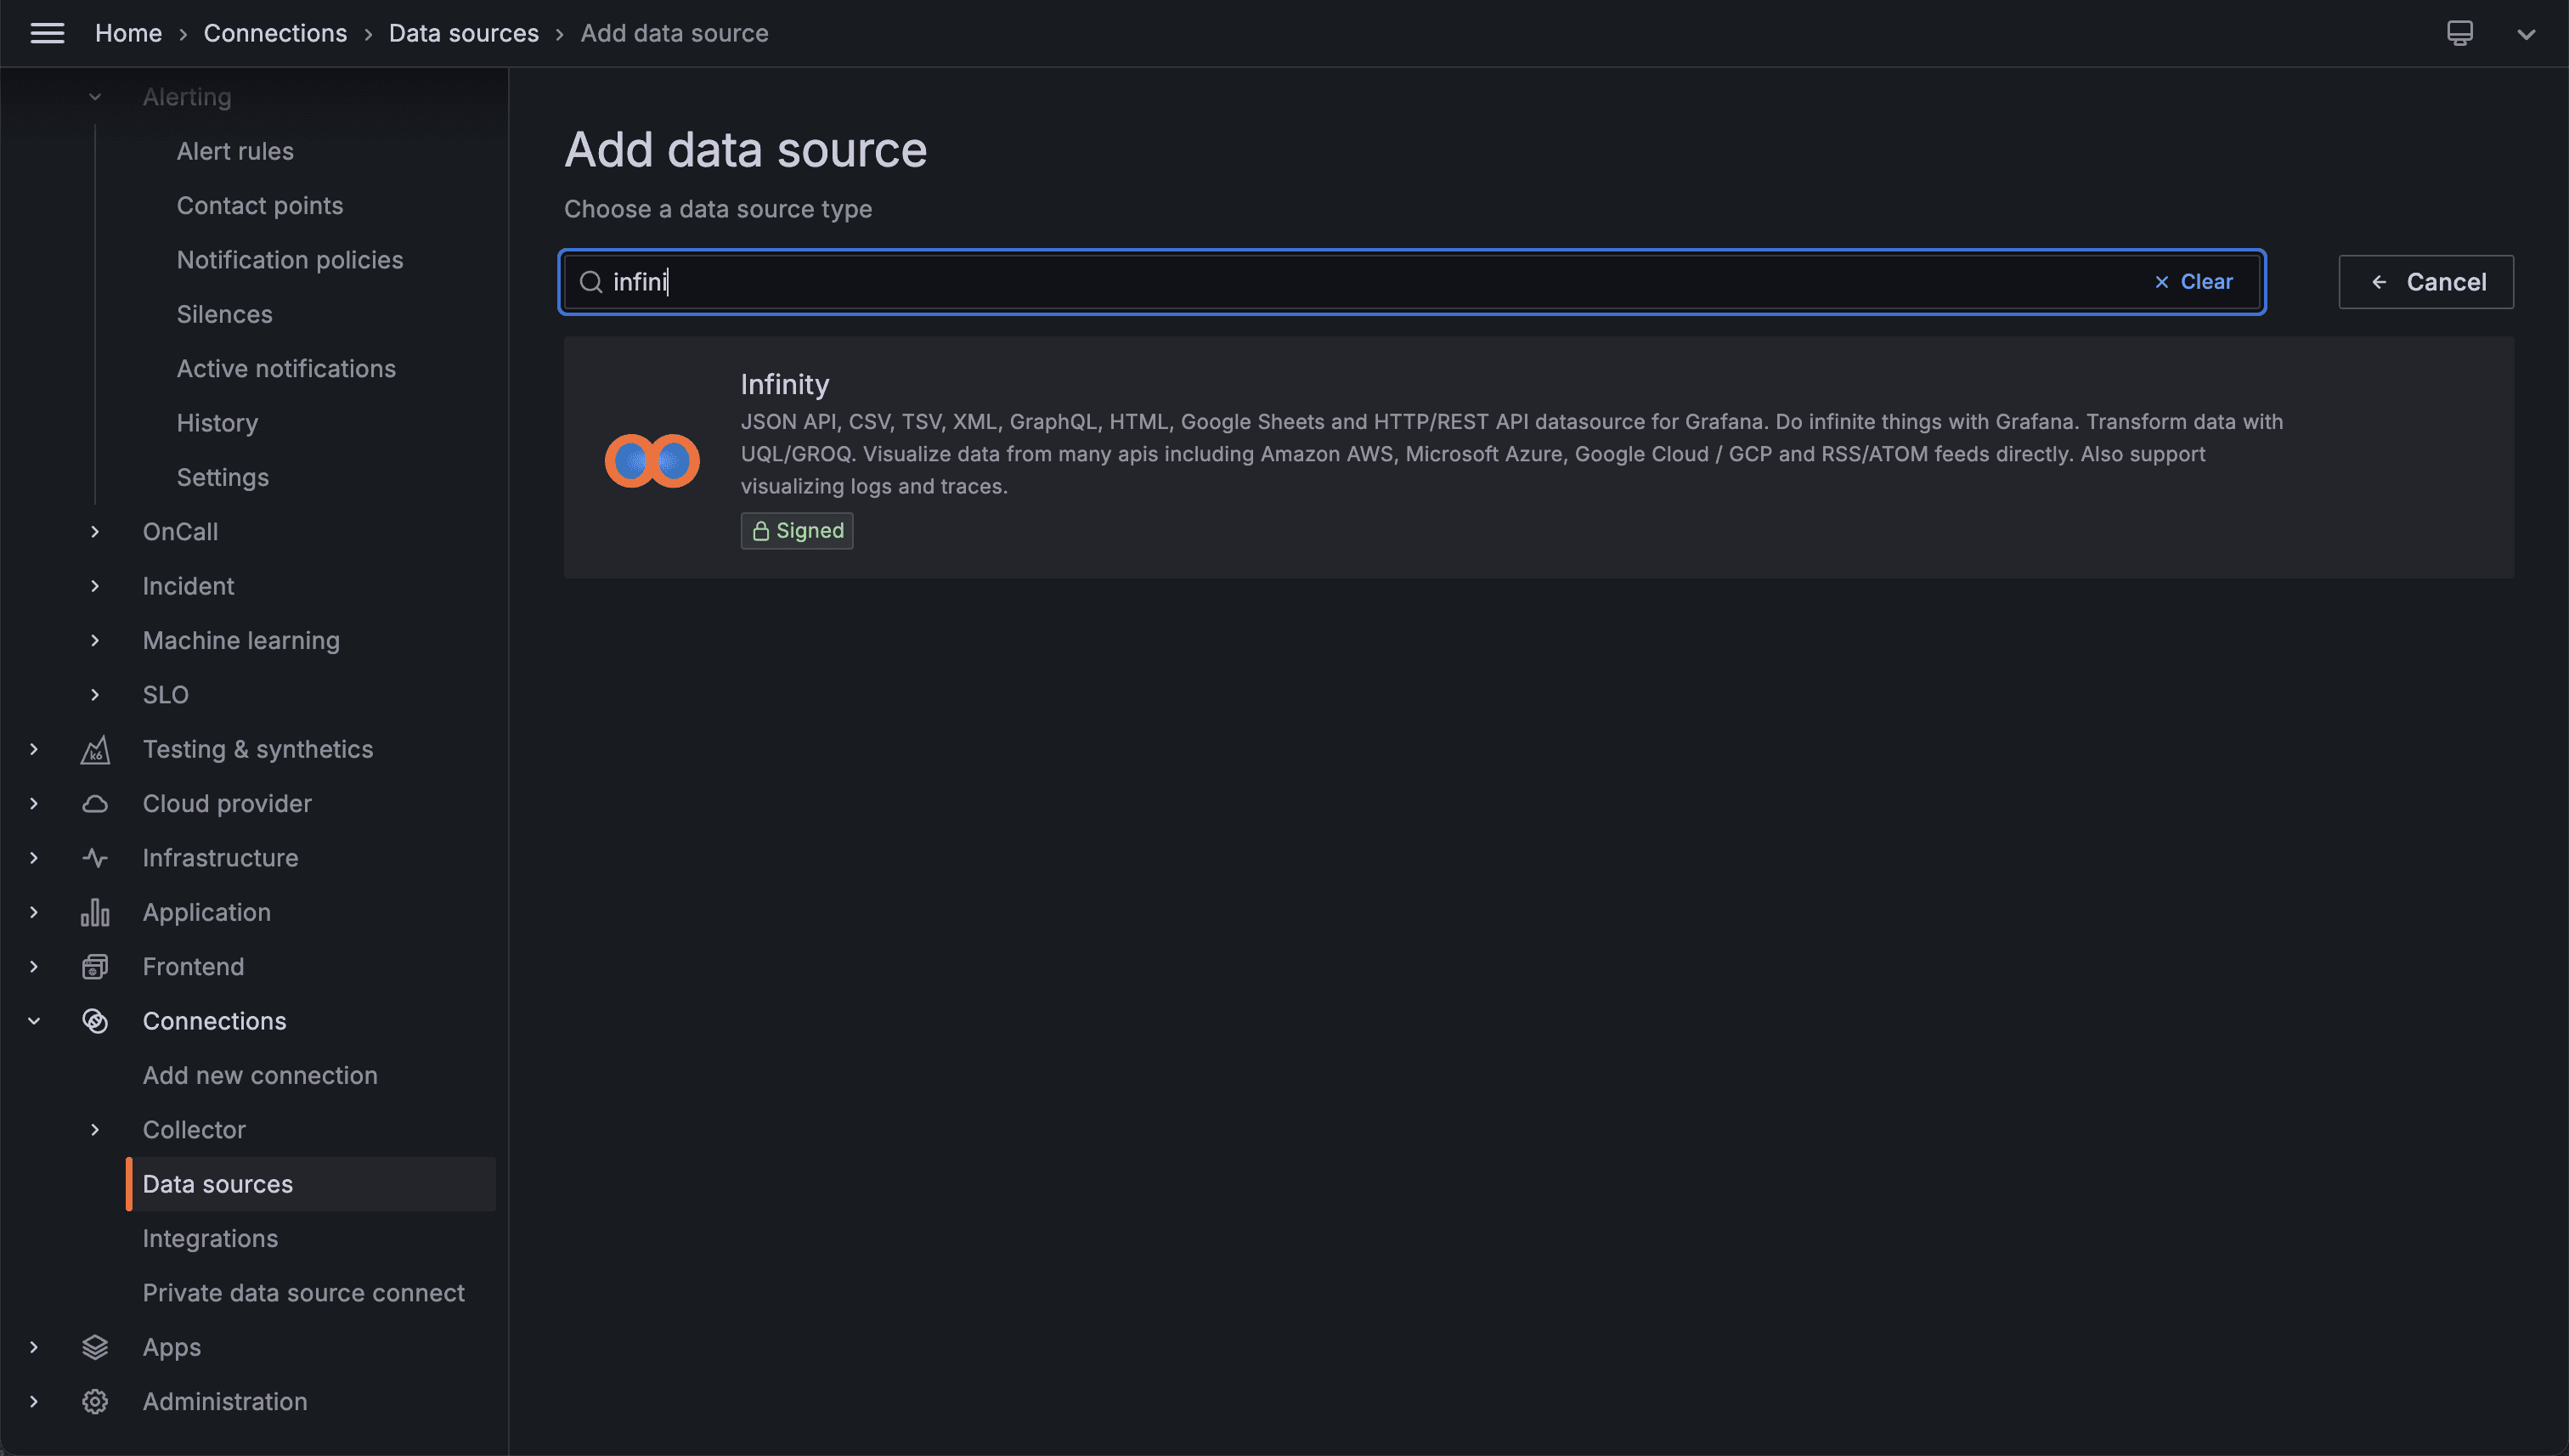
Create a new Data Source using the Infinity plugin. Connections > Data sources > Add new data source > Infinity.
Edit the name and complete the basic setup:
Authentication: choose Bearer Token. Pick a token with access to all the needed endpoints or create different data sources per token. Feel free to also add a restrictive list of allowed hosts.
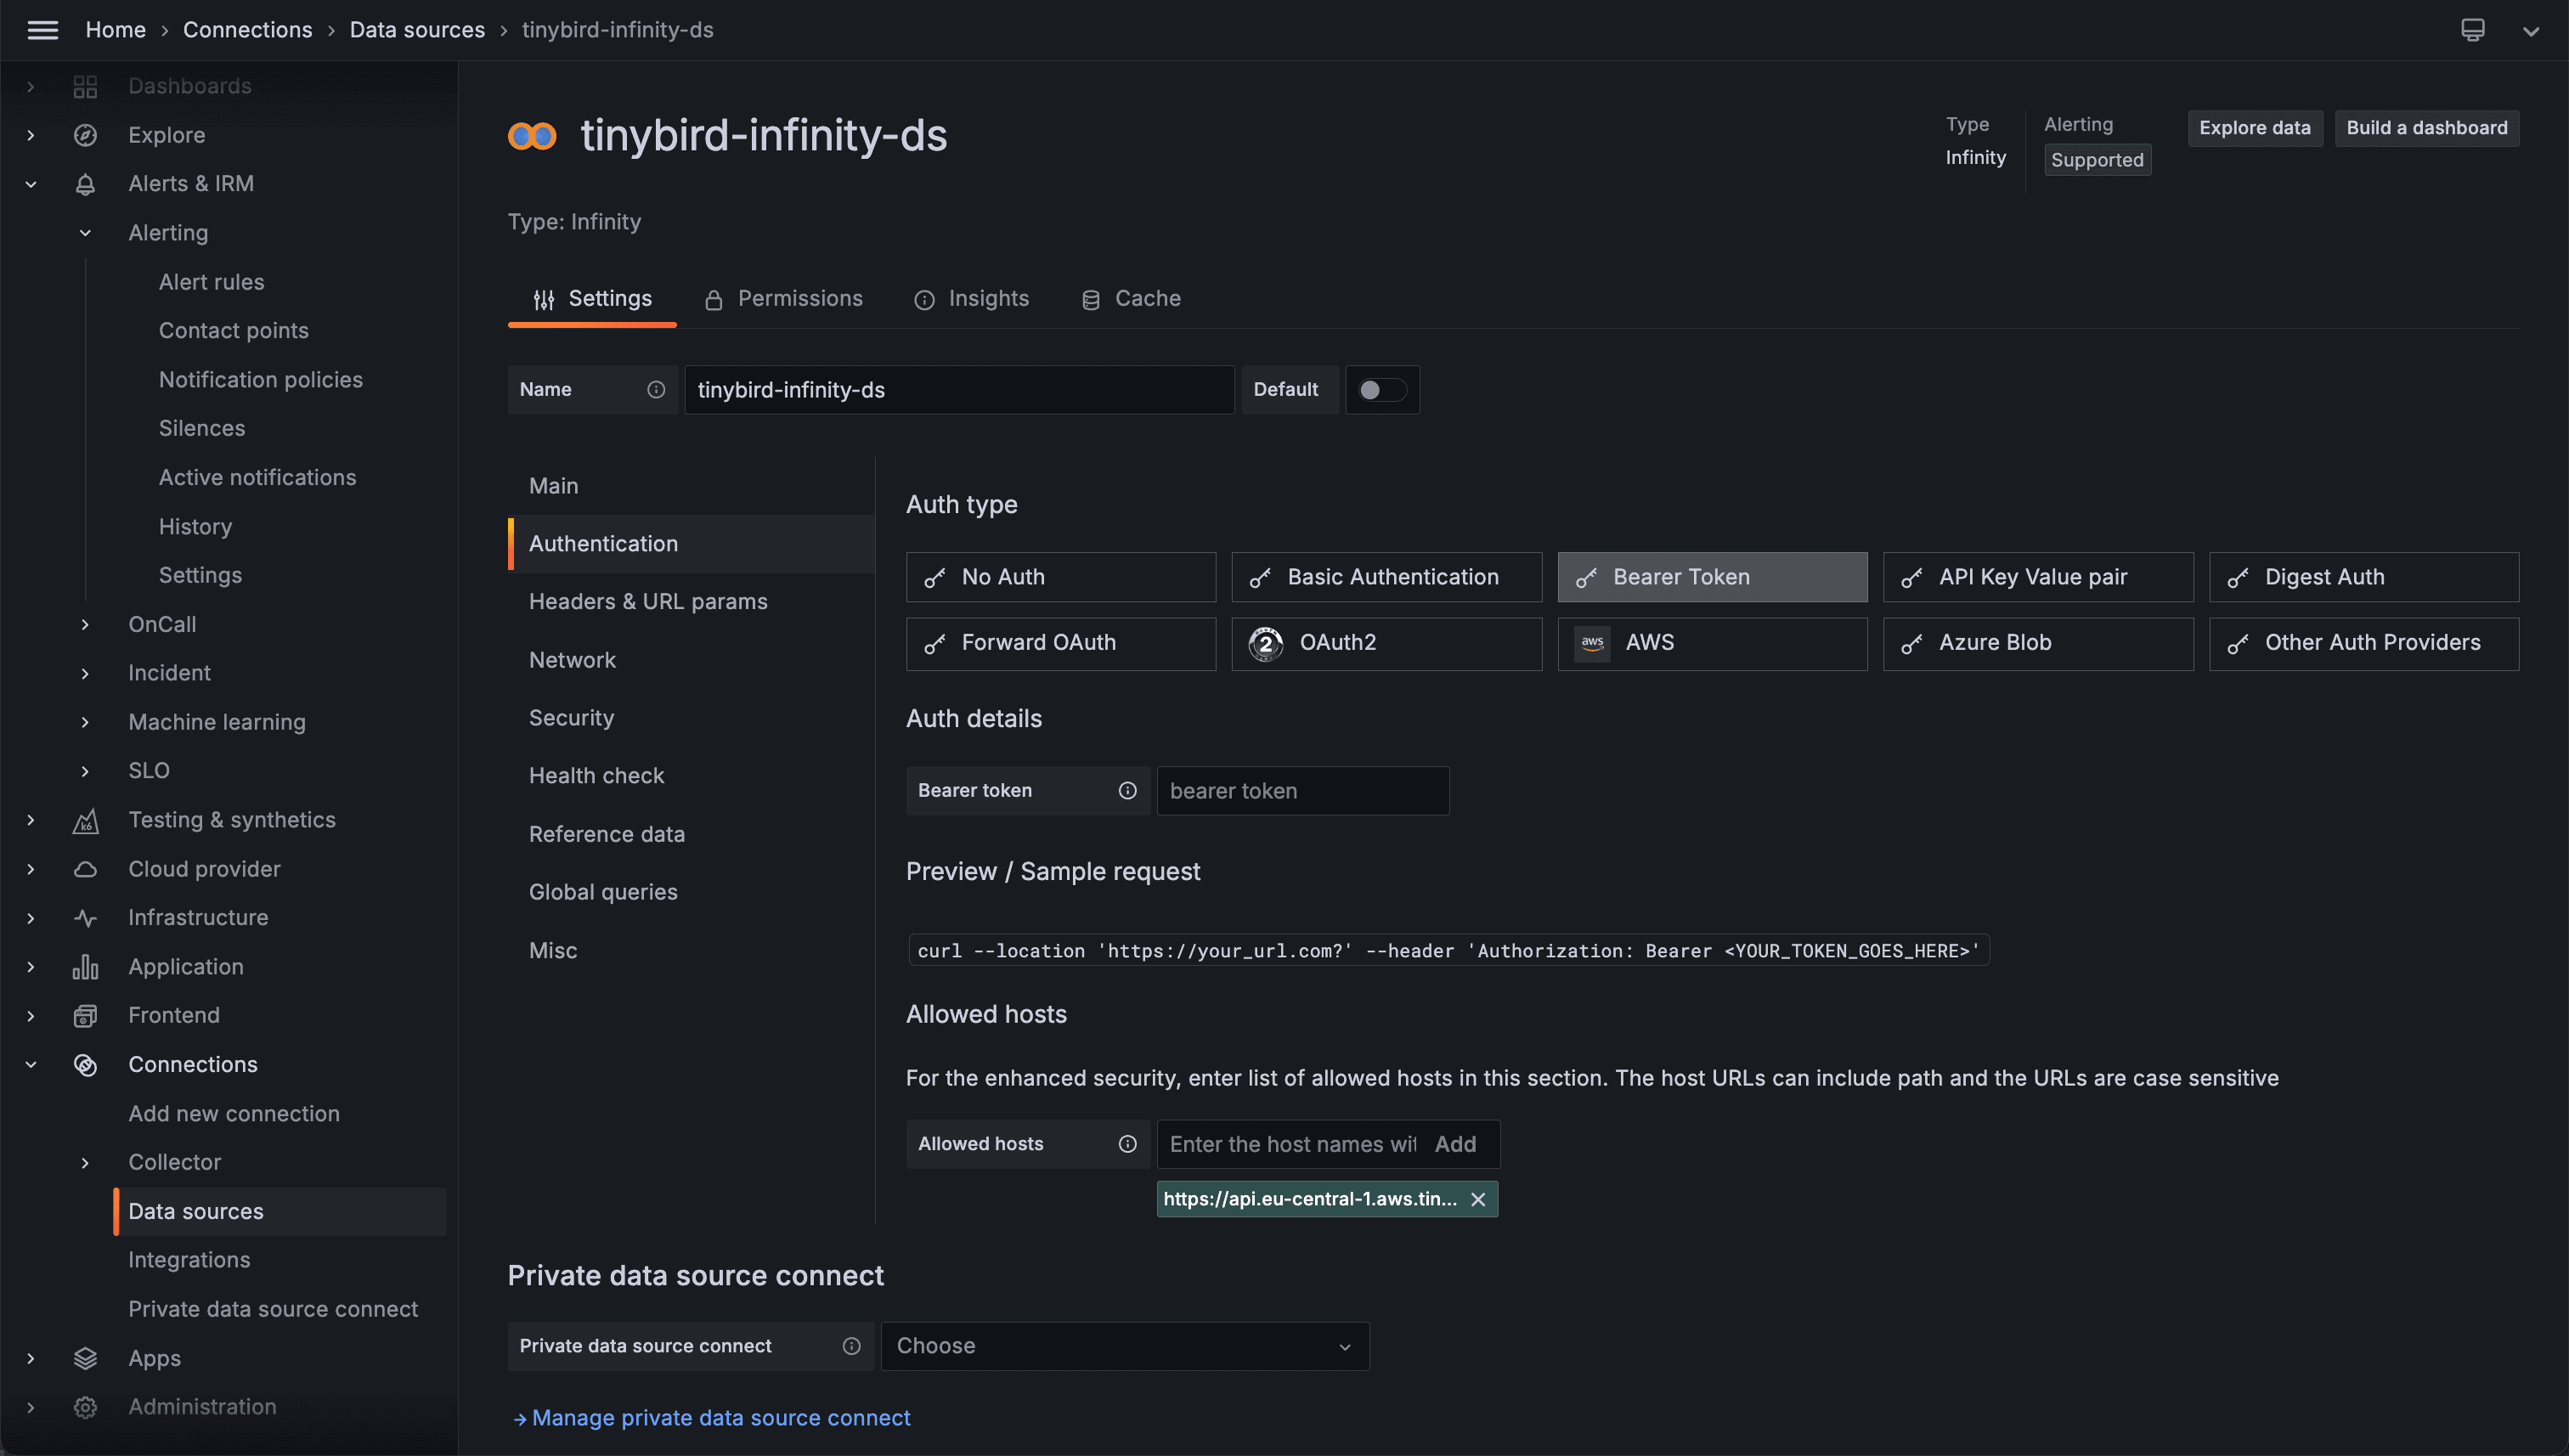
That's basically it, but it's a good practice to add a Health check with an endpoint that the Token has access to so you verify connectivity is OK.
3. Configure the Query in Grafana
Create a new Dashboard, edit the suggested Panel, and use the Data Source you just created.
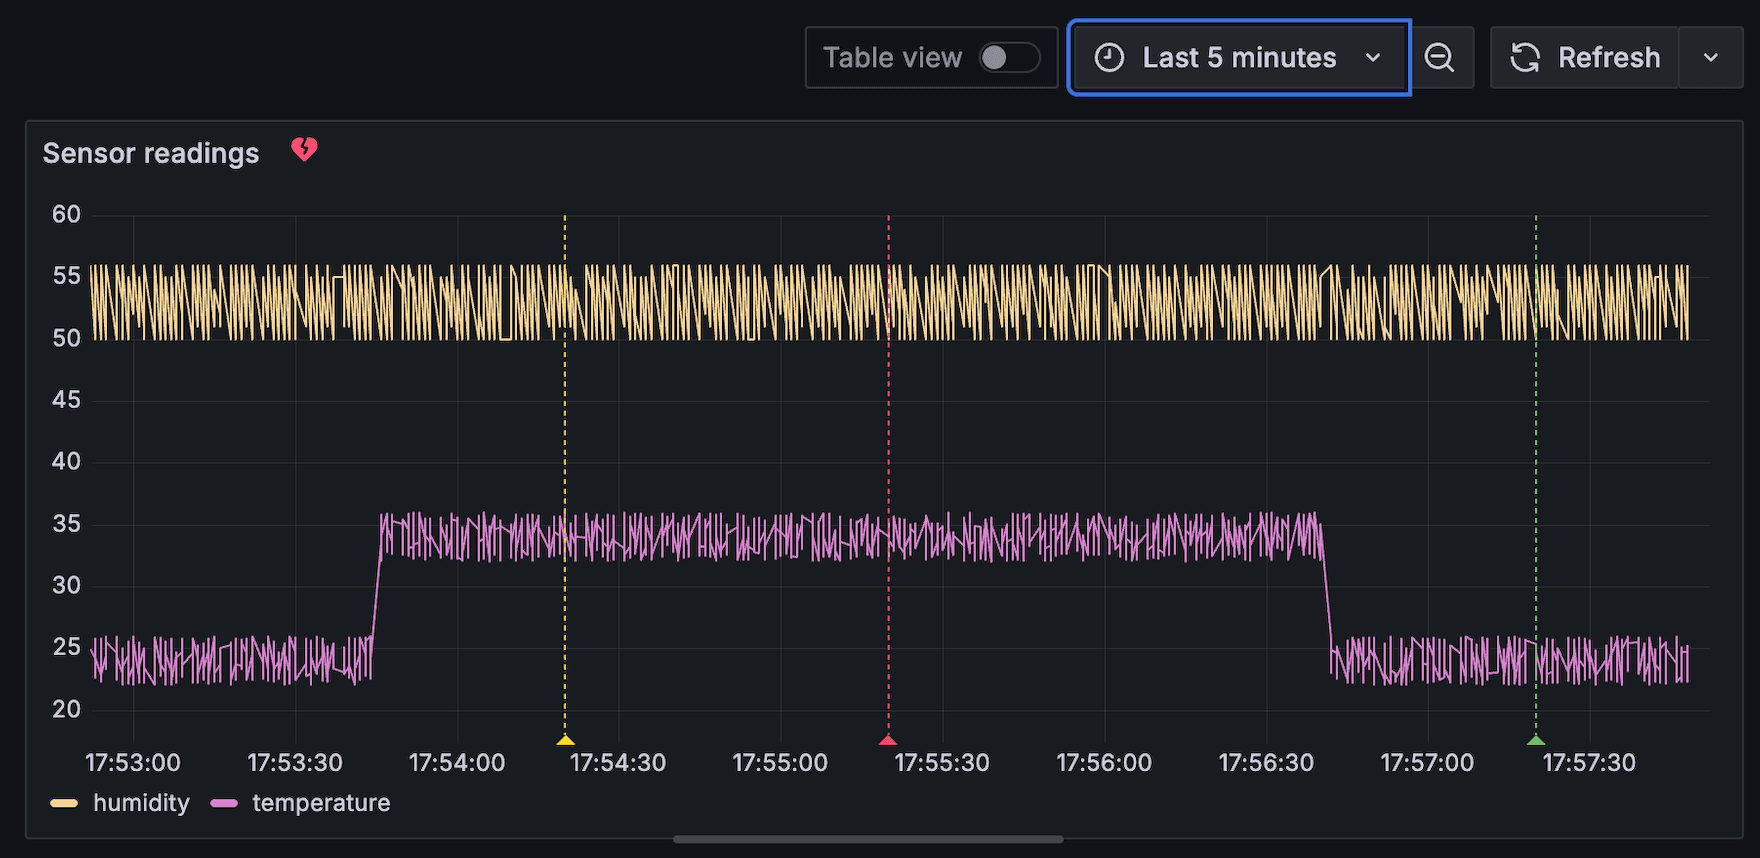
For the example you'll consume the endpoint shown in this picture. A time series of sensor temperature and humidity readings.
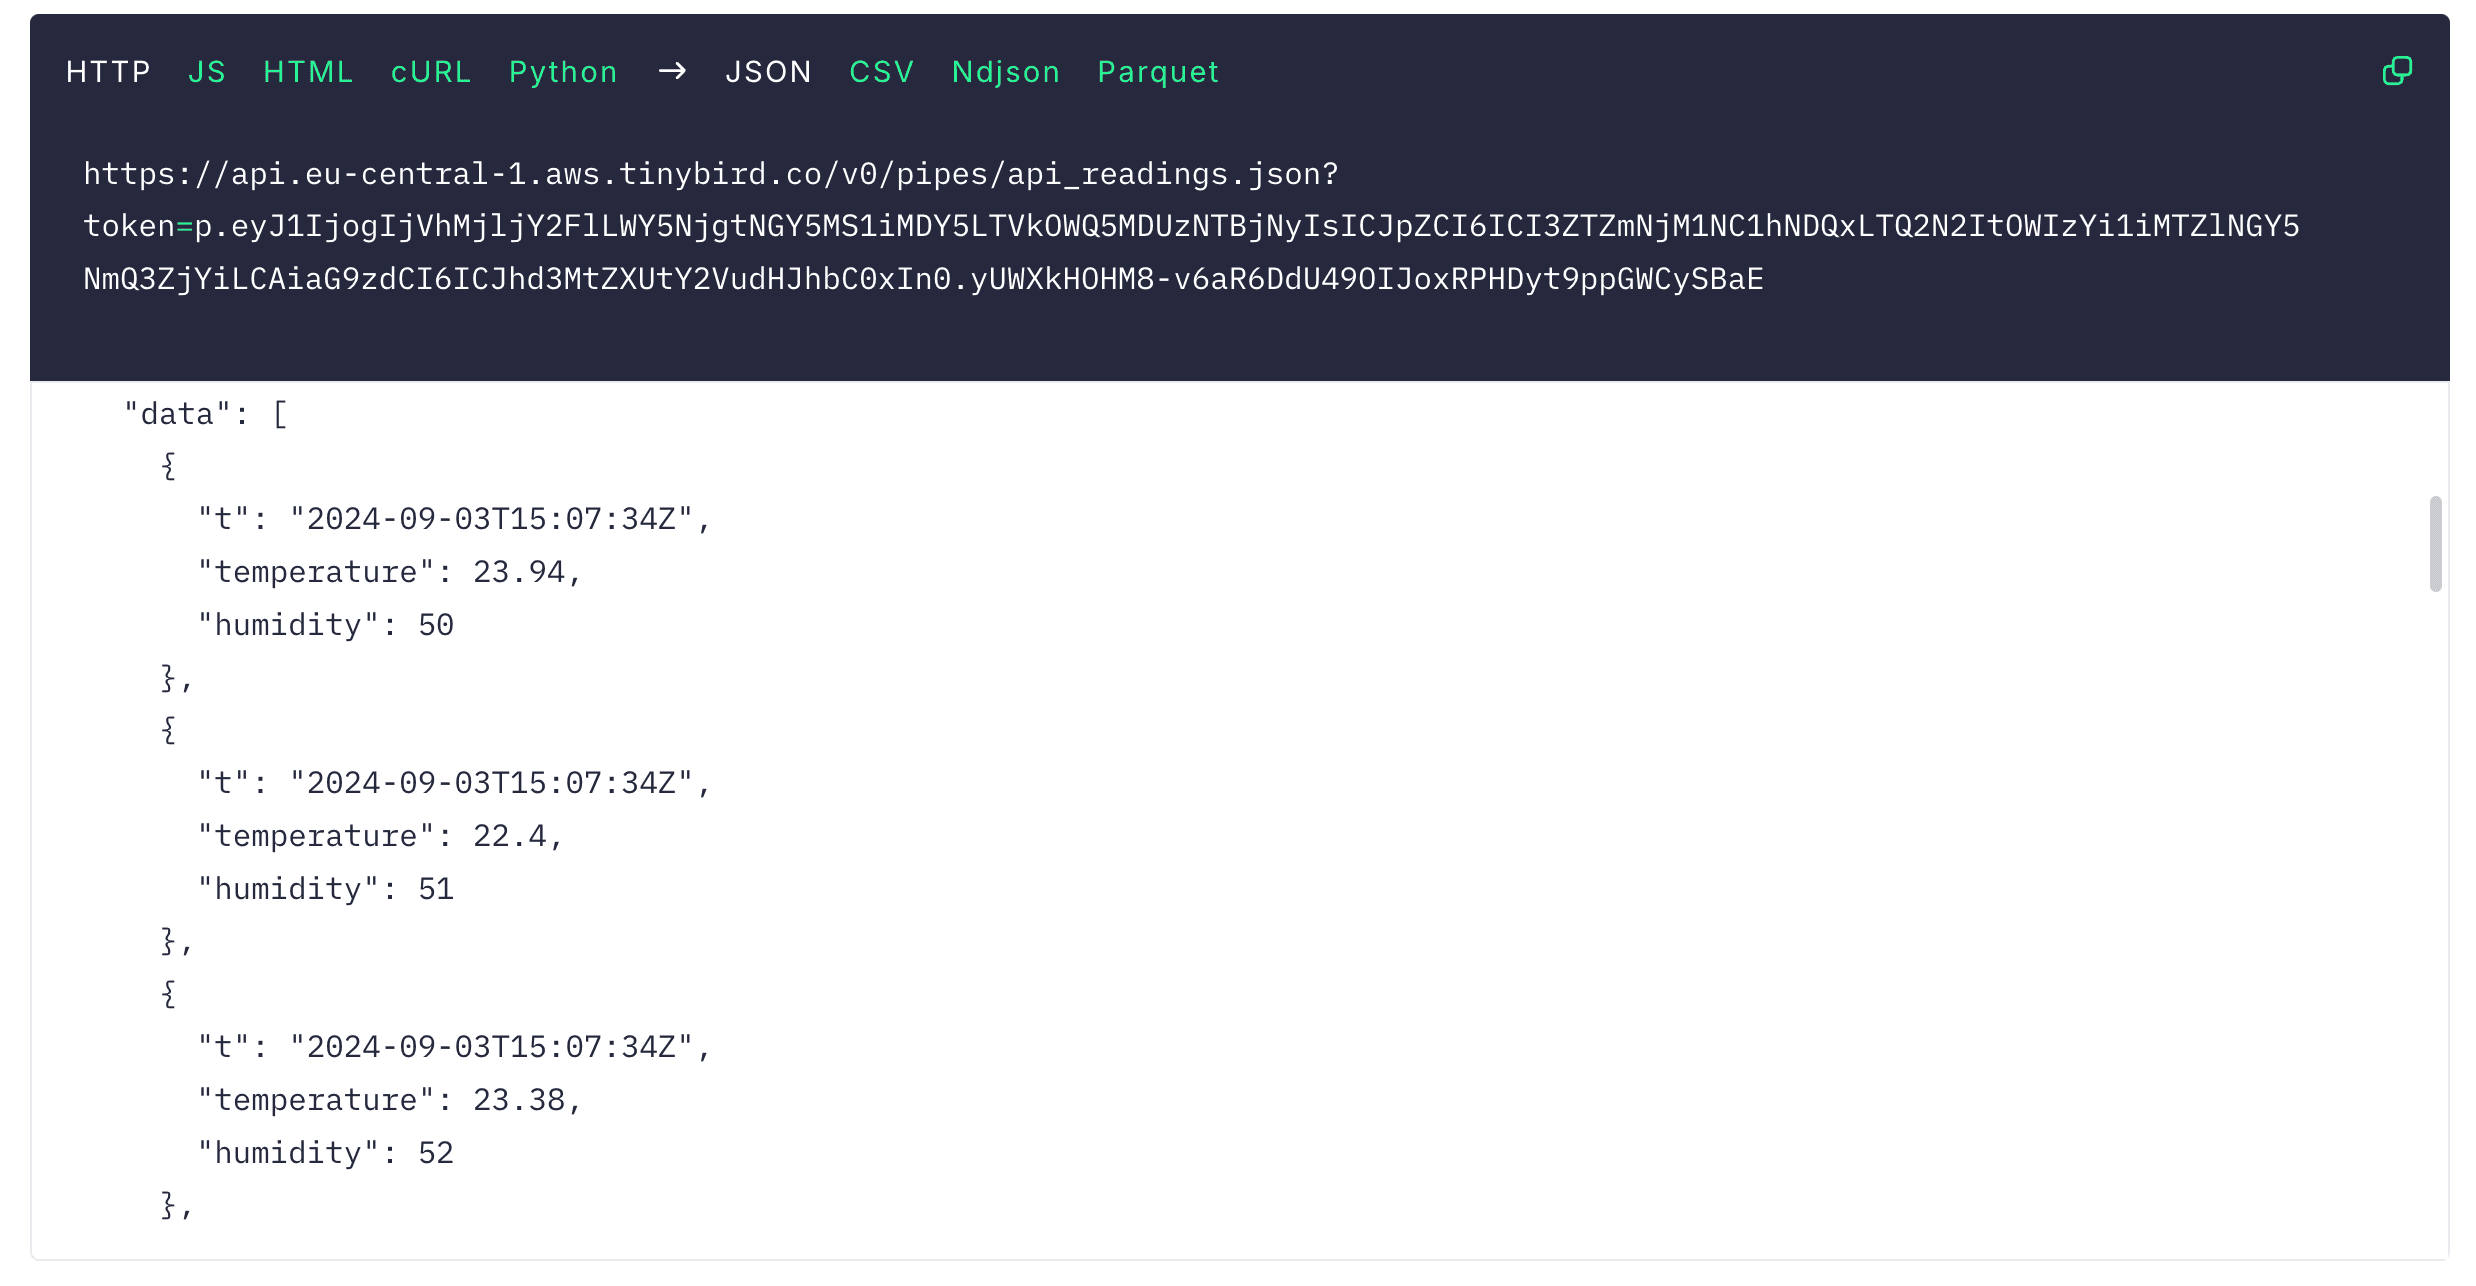
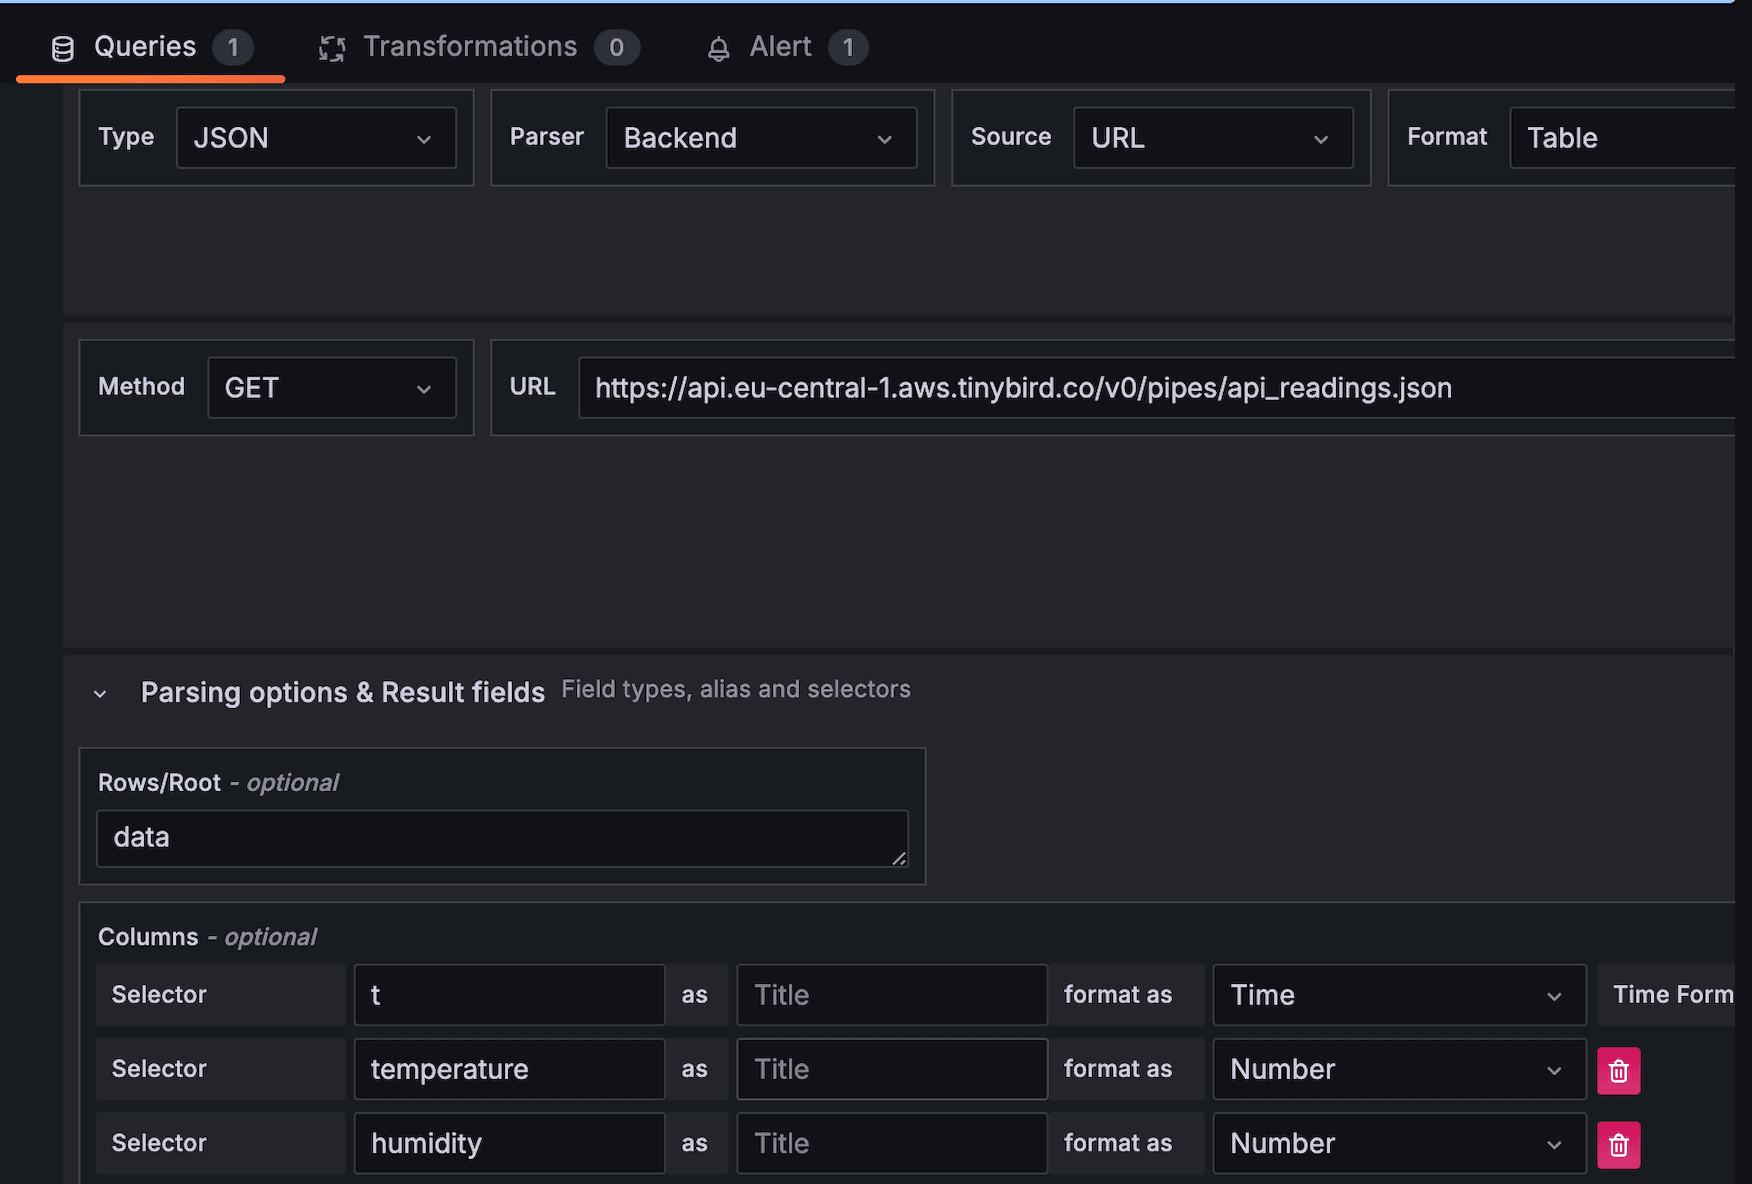
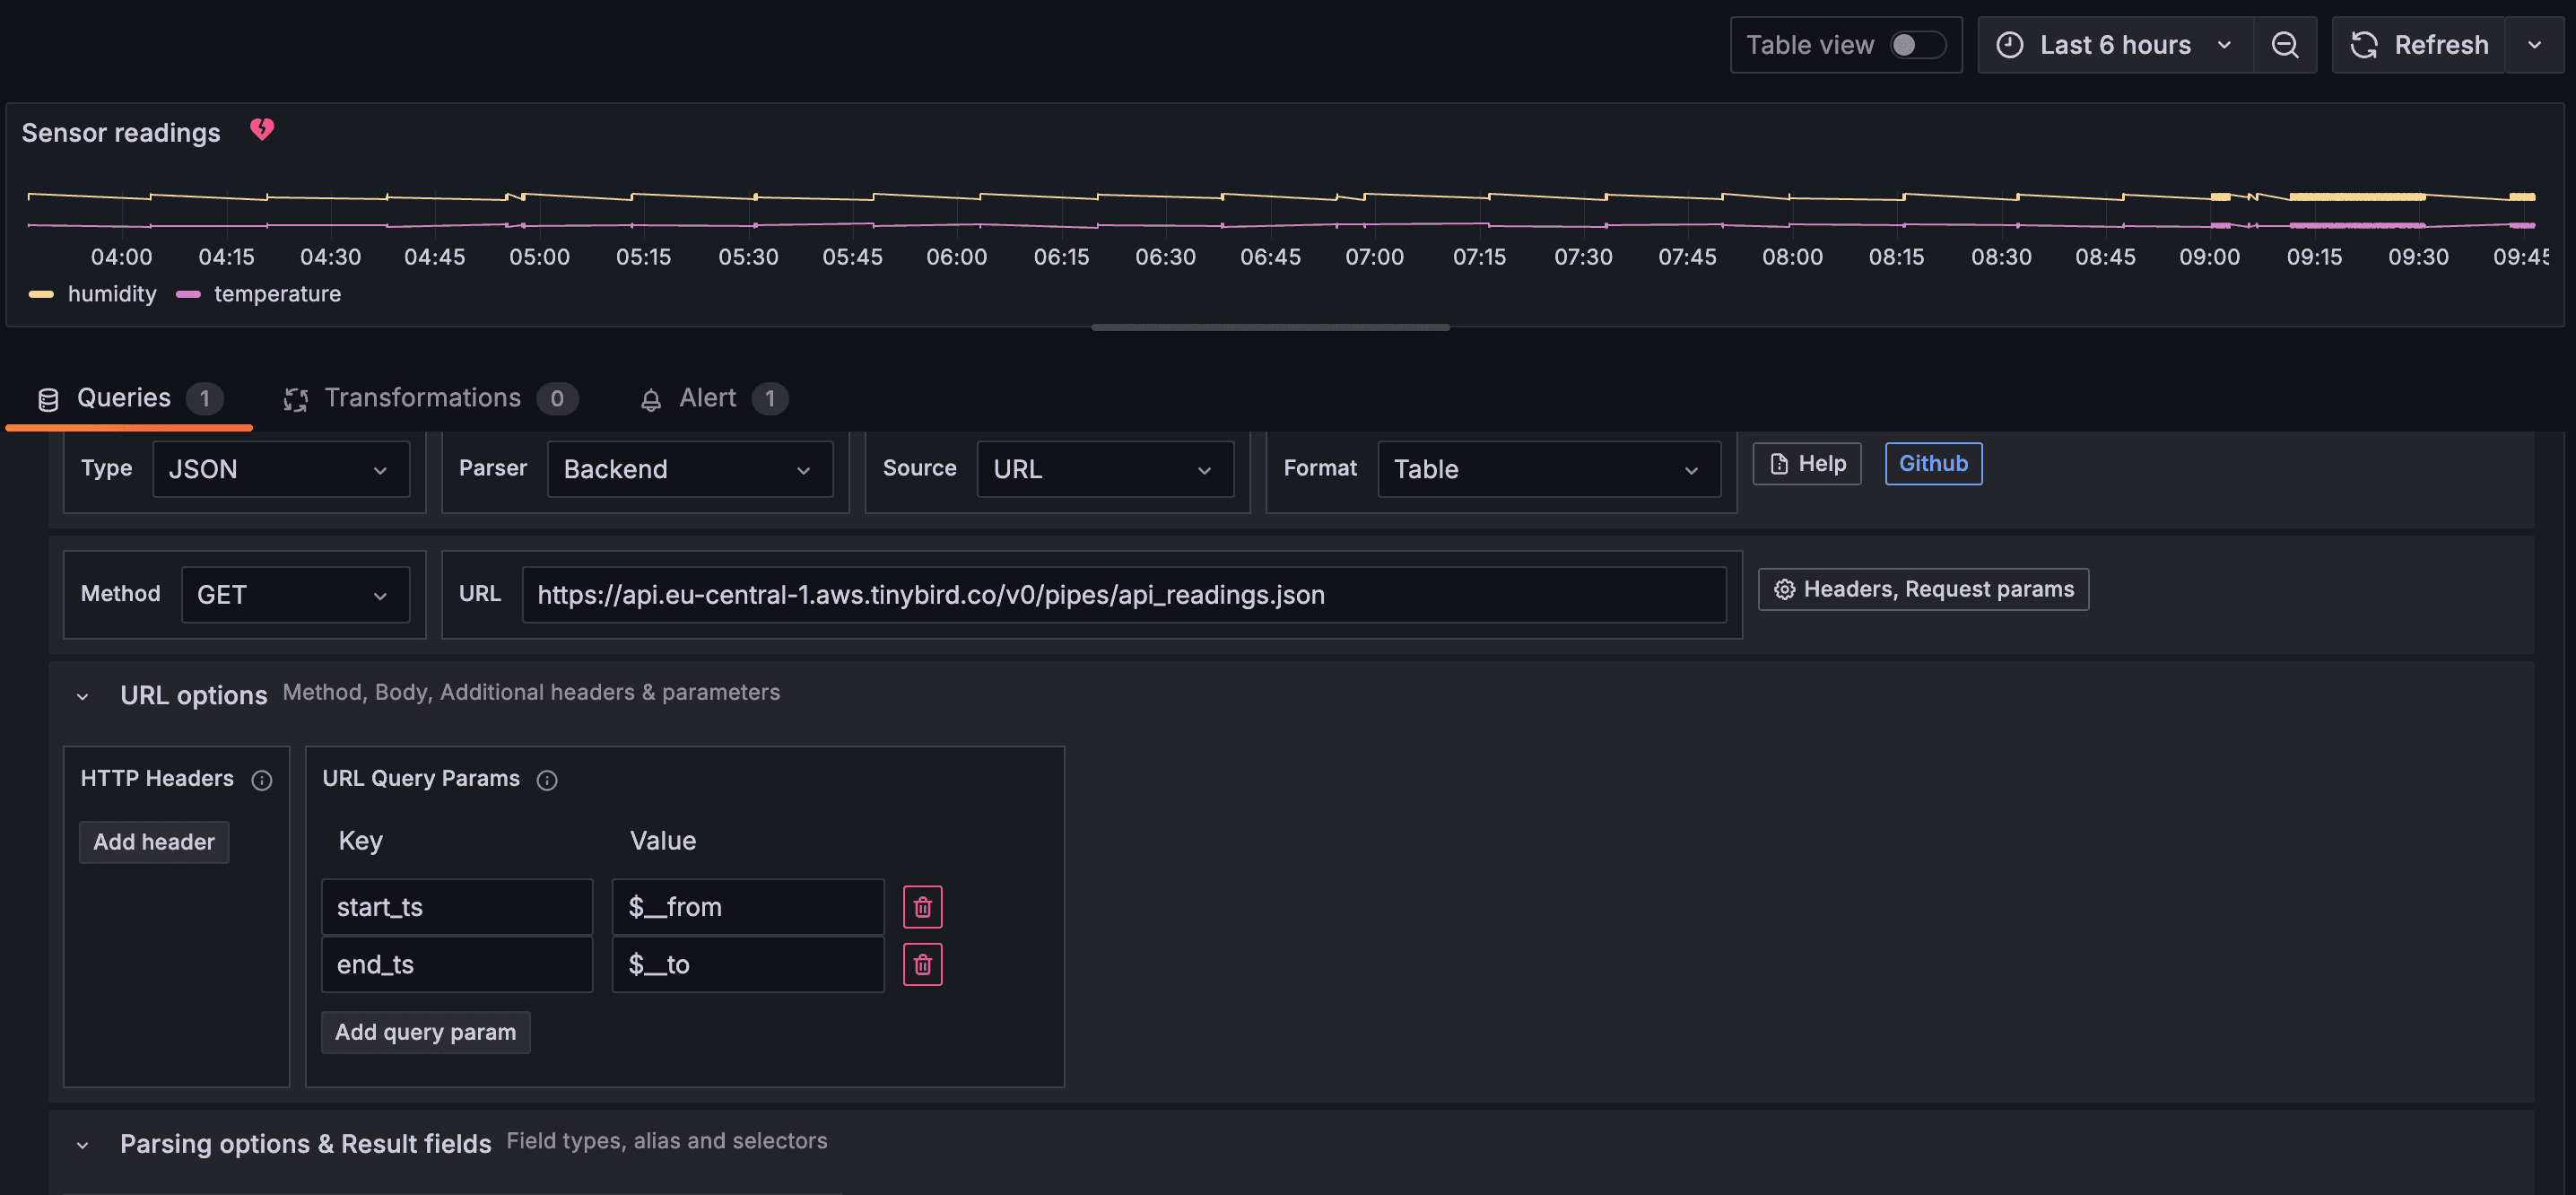
So, the in the Query editor is:
- Type: JSON
- Parser: Backend (needed for alerting and JSON parsing)
- Source: URL
- Format: Table
- Method: GET
- URL:
https://api.eu-central-1.aws.tinybird.co/v0/pipes/api_readings.json - Parsing options & Result fields > Rows/root:
dataNeeded cause the Tinybird response includes metadata, data, statistics... - Parsing options & Result fields > Columns: add the needed fields, select types, and adjust time formats.
It is important to use the Backend Parser for the Alerts to work and for compatibility with the root and field selectors as mentioned in the plugin docs.
For the Time Formats you can use plugin options. By default it uses Default ISO so you can simply add formatDateTime(t,'%FT%TZ') as t to your Tinybird API Endpoint and don't need to configure the option in Grafana.
Save the dashboard and you should now be able to see a chart.
4. Using time ranges
When you have millions of rows it's better to filter time ranges in Tinybird than to retrieve all the data and filter later when showing the chart in Grafana. You will get faster responses and more efficient use of the resources.
Edit the Tinybird Pipe to accept start_ts and end_ts parameters.
%
SELECT formatDateTime(timestamp,'%FT%TZ') t, temperature, humidity
FROM readings
{% if defined(start_ts) and defined(end_ts) %}
WHERE timestamp BETWEEN parseDateTimeBestEffort({{String(start_ts)}})
   AND parseDateTimeBestEffort({{String(end_ts)}})
{% end %}
ORDER BY t ASC
In the Query editor, next to URL, click on Headers, Request params and fill URL Query Params.
Use Grafana's global variables $__from and $__to defined with the time range selector at the top right od the dashboard.
As said, filtering helps to have more efficient dashboards, here you can see how using filters, the scan size decreases.

5. Dashboard variables
You can also define dashboard variables and use them in the query:
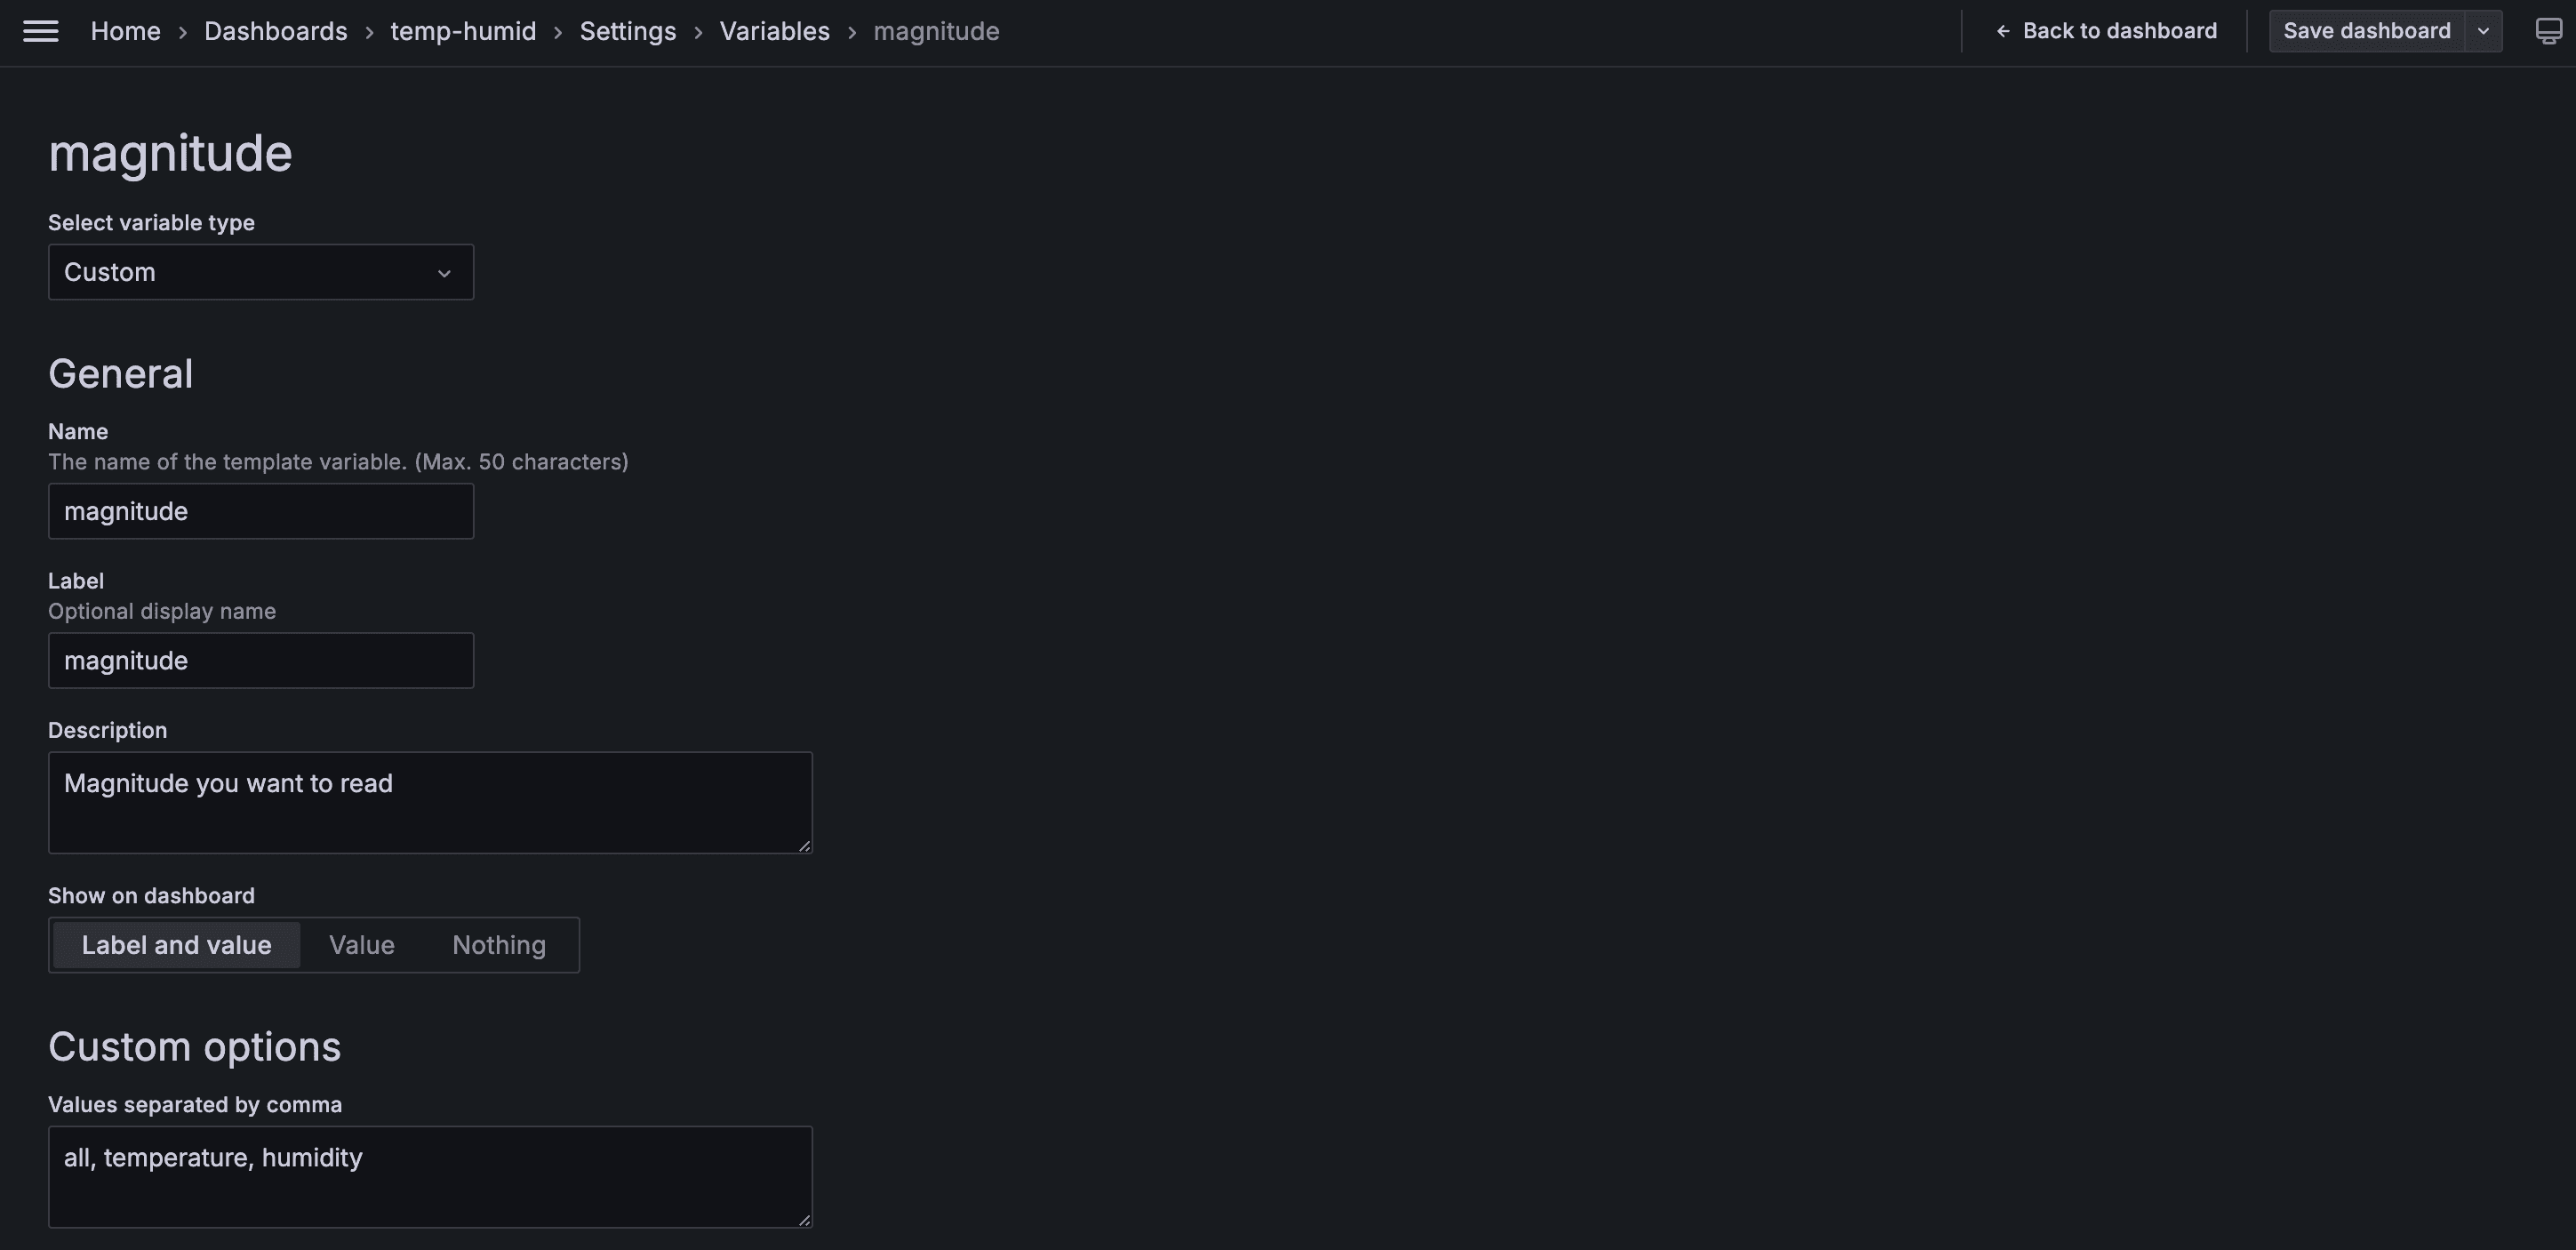
That will make it interactive:
Note you have to edit the Pipe:
%
SELECT formatDateTime(timestamp,'%FT%TZ') t,
{% if defined(magnitude) and magnitude != 'all' %}
{{column(magnitude)}}
{% else %}
temperature, humidity
{% end %}
FROM readings
{% if defined(start_ts) and defined(end_ts) %}
WHERE timestamp BETWEEN parseDateTimeBestEffort({{String(start_ts)}})
   AND parseDateTimeBestEffort({{String(end_ts)}})
{% end %}
ORDER BY t ASC
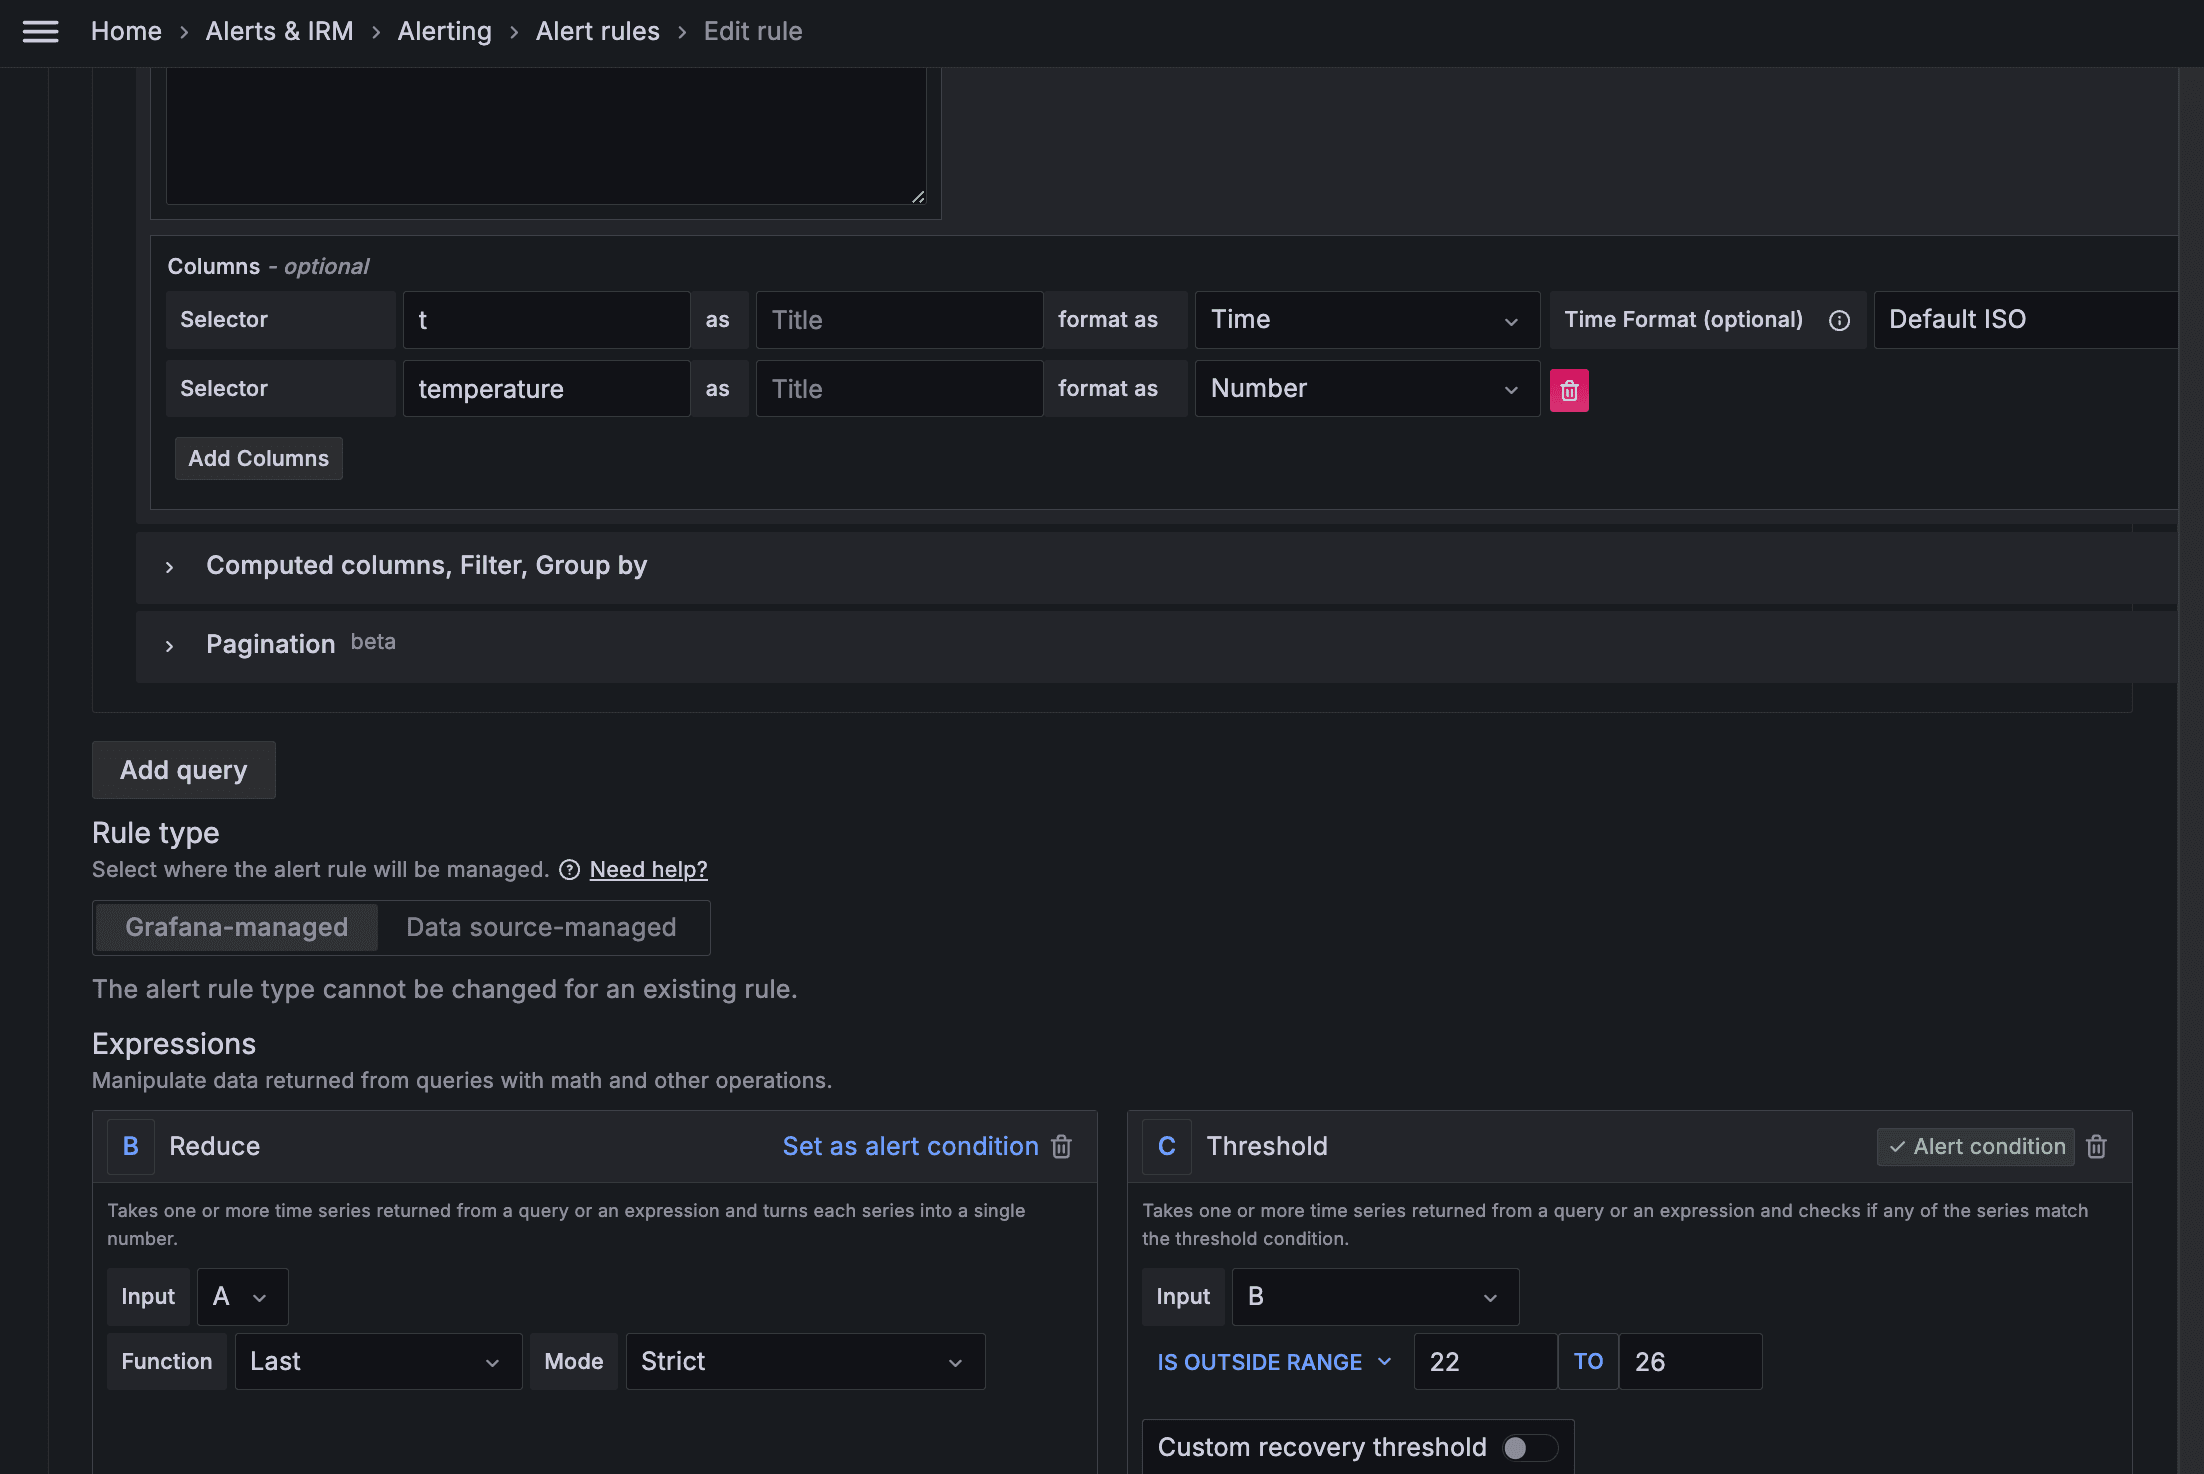
6. Alerts
Infinity plugin supports alerting, so you can create your own rules. In this example alert triggers when temperature goes outside a defined range.
And this is what you will see in the dashboard.
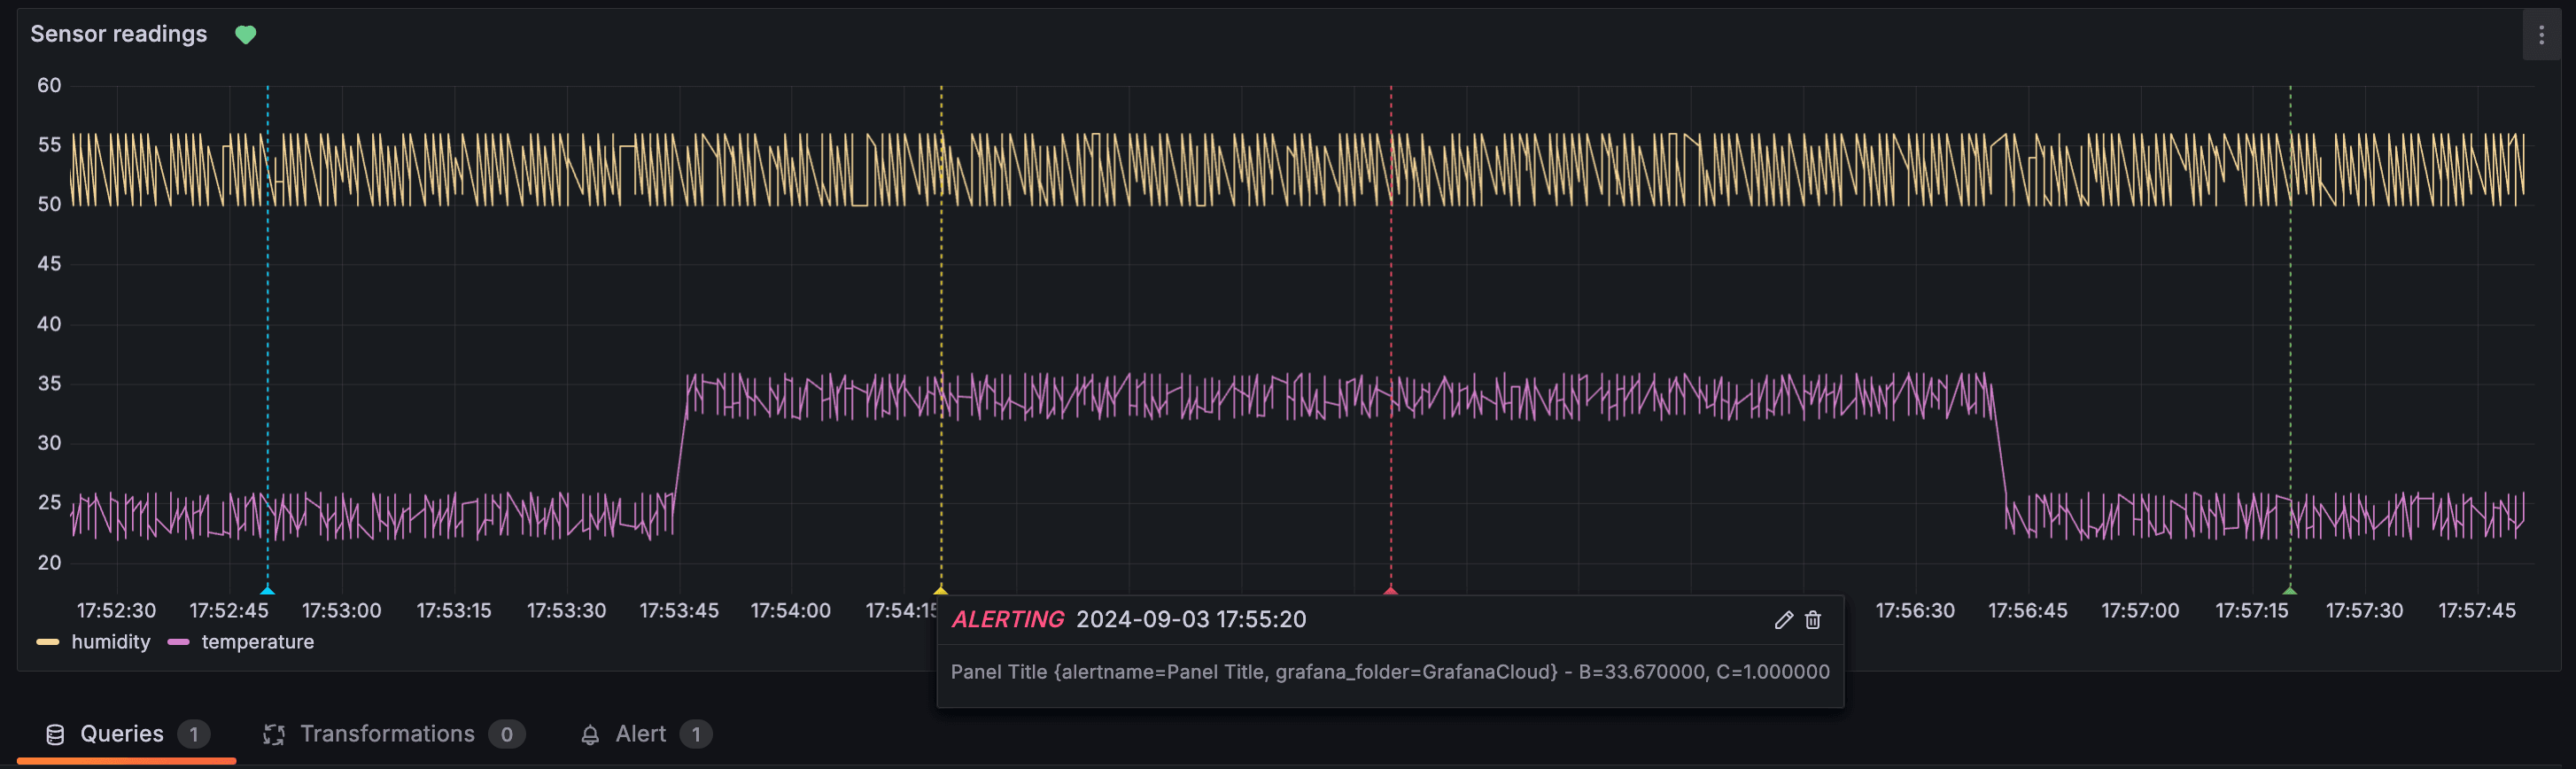
Be sure to correctly set up notifications if needed.
Note
Note: a previous version of this guide referred to the JSON API plugin but it was migrated to using Infinity plugin since it's now the default supported one.