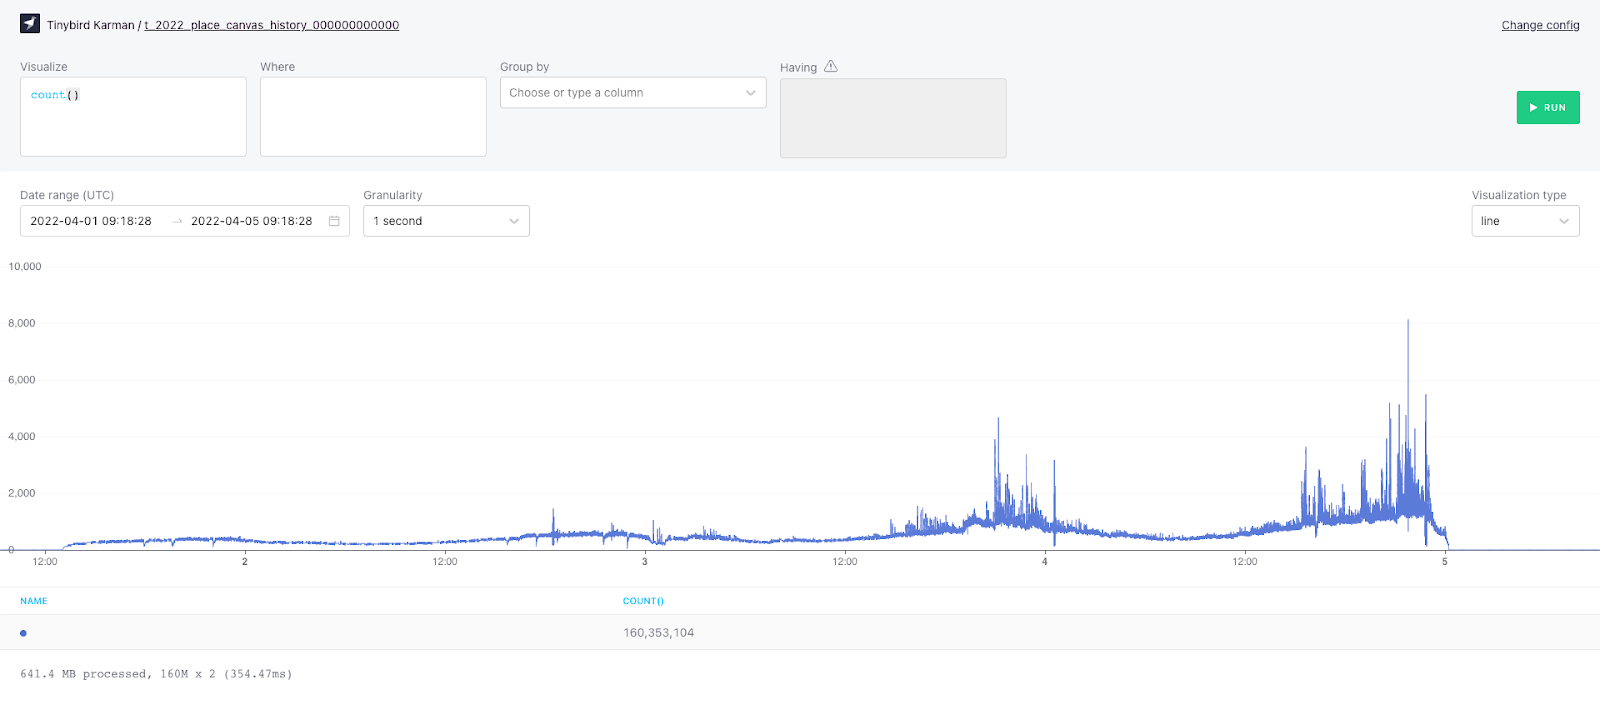
On April 2nd, 2022 reddit temporarily went down. Rumor has it this was caused, at least in part, by the second r/place event. If you’re unfamiliar with r/place, you can read up on it here. But the tl;dr is that the 2022 event was a social experiment where millions of users from across the internet vied for pixel dominance, placing 160M timestamped pixels onto a common canvas over the span of 4 days. The timelapse is mesmerizing:
Building a collaborative drawing canvas seems like a pretty simple project on the surface, but it’s actually really hard, especially at the scale of r/place (As many as 90K concurrent users created up to 8k concurrent write events per second). We recently shared 8 challenges building high-concurrency, low-latency data apps on massive-scale data, and r/place checks all eight boxes.

Recently, I did a live coding session with my coworker Raquel to demonstrate how you could solve this difficult problem. In less than 45 minutes we used Tinybird and some Javascript to recreate the 2022 canvas, plus build a new canvas of our own.
If you were casually watching the livestream, you may have missed the significance of what happened, so I’ll say it here: Two people who aren’t data engineers put a data-intensive real-time app into production in about half an hour. No infrastructure, no backend setup, no nothing. Just two developers and Tinybird.
I wanted to write this blog to dig into what we did and why it’s so important for developers trying to solve high-concurrency, low-latency problems like r/place.
Let’s start with the frontend.
You don’t need Kafka for events streaming
One thing the canvas has to do is send pixel placement data to a streaming event handler. You might approach this problem with something like Kafka, but with Tinybird, you really just need a (free) account and a few lines of javascript:
The hard part is actually mapping the pixel data to ndjson. From there it’s just a simple POST to the Tinybird /events API.
10 lines of SQL for a backend
When you start working on a project like this, the frontend feels like the easy part. But that wasn’t the case with Tinybird. I would say that between the two of us, Raquel and I spent probably 80% of our time building the frontend, and the remaining 20% on the backend AND on creating some cool analytical visualizations from the 2022 r/place canvas.
In fact, the backend was really just 10 lines of SQL written in the Tinybird UI:
These 10 lines of SQL took the incoming placement events sent to pixels-table datasource using the Tinybird /events endpoint, got the most recent color placed on that coordinate (using argMax… more below), and - using templating language - defined the parameter start_date so the frontend could request only added data since it’s last request.
That argMax function alone saved me a lot of time by grabbing the most recent color - based on the max timestamp associated with those coordinates - in a single line. If you’ve ever wanted to do point-in-time SQL queries, like aggregation on one column based on another timestamp column, you’d need to use a window function with vanilla SQL. But with Tinybird (which uses ClickHouse® functions) it’s trivial.
I augmented this code a bit to let the frontend choose between displaying the active canvas or the historic 2022 r/place event canvas. This was as simple as adding another node to my existing pipe with a historic_date parameter, and using a final node to pull data from either preceding node depending on which parameter was requested. You can see that code here.
And then of course as a cherry on top you have the Tinybird secret sauce that turns that final node into a parameterized API endpoint in a single click.

And here is that API being called in the frontend:
Just to put things into perspective: The frontend app is already super simple and compact: 41 lines of HTML + 181 lines of javascript + 121 lines of CSS = 343 total lines of code.
The entire backend was written in 58 lines of code in Tinybird.
Data as Code


