When I first joined Tinybird as the Content Marketing Lead, one of my first questions was “Can I get access to Google Analytics?”
I’m a content guy. I’ve basically lived in Google Analytics for my entire content marketing career, and I love analyzing visitor behavior with tools like the Content Drilldown or the Site Behavior flow. It’s also just necessary for me to know how people are arriving on our site, interacting with our content, and (hopefully) becoming Tinybird users. It’s how I know I’m doing my job well.
So I was a bit taken aback when the response to my question was…
“We don’t use Google Analytics.”
Me: What? Really??
Yes. Really.
Me: Why?
We have our own analytics built with Tinybird and Retool.

Okay so that’s not exactly how it went down, but pretty close. In part, Tinybird doesn’t use Google Analytics because we don’t use third-party cookies to track behavior on our website. Given some of the recent GDPR rulings, we figured it would be better to avoid it if we wanted to protect our visitors’ privacy. Plus, this was a great opportunity to “eat our own dog food” by building our analytics in Tinybird. And finally, Retool is a decidedly awesome way to very quickly visualize the metrics we needed without any lift from our engineering team.
When I interviewed at Tinybird, I assured them I wasn’t a completely hopeless anti-technical marketer. I’ve written a fair amount of SQL, a good dose of Python, and even some jQuery back in my day. This was my opportunity to prove that I wasn’t full of it.
So I started building.
Over the next few weeks, I’m going to share how I’ve replicated three of the Google Analytics views that I’ve relied on most in my Content Marketing career using Retool and Tinybird. Hopefully, it gives you a taste of how easy and fast it is to (1) analyze web events data in Tinybird, and (2) visualize the results in Retool.
In this first post, I’ll briefly explain how I get web events into Tinybird, and how I’ve recreated one of the simplest Google Analytics widgets with Retool.
How to get web events into Tinybird
As the above back-and-forth hinted, I didn’t necessarily have to start from scratch. When I joined Tinybird, a cross-functional team of web gurus at the company had already written some privacy-first JavaScript to send events to Tinybird using the Tinybird Events API. They had installed this JavaScript on the Tinybird domain, and it was already sending some basic pageview events to a Tinybird data source.
The tracker, which uses a first-party cookie, sends over information about the event that was tracked, the timestamp of the beginning of the session, the timestamp of the event, the URL where the event took place, and the randomized ID of the visitor. The use of a first-party cookie gives us more control over what data is collected and where it is stored, which lets us more confidently adhere to global data privacy laws.
With the events being passed to Tinybird, it was up to me to figure out how to recreate my go-to Google Analytics widgets.
Creating the default Google Analytics traffic widget
When you land on Google Analytics, the first thing you see is a default dashboard with a collection of widgets. In this post, I’ll show you how I created the default traffic widget, which looks like this:
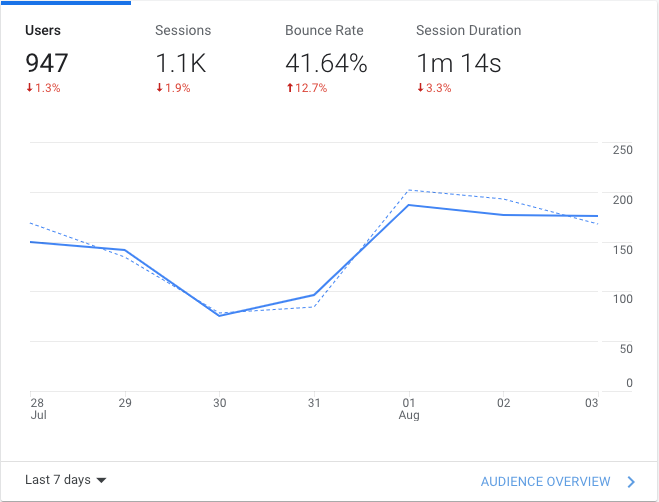
There are 6 core components to this widget: The first is a timespan selector, which serves as an input for each of the other 5 components. Up top, you have 4 metrics: Users, Sessions, Bounce Rate, and Session Duration, with comparisons to the last time period. You can click any of these sessions to choose what’s displayed on the final component, a line chart showing that metric over the time period.
Here are the steps I followed to recreate this widget with Tinybird and Retool.
Step 1: Define Sessions
In web parlance, a “session” is a collection of events that begins when a visitor enters the domain and ends when they exit the domain. Since the JavaScript tracker sends raw, timestamped events into a Tinybird data source, the first thing I needed to do was construct sessions from these events in my Tinybird workspace.
Here’s the SQL I wrote in a Tinybird Pipe to do just that:
A few notes about this:
- I created a hashed session ID by using the built-in ClickHouse function
cityHash64()on the concatenated session ID and the entry timestamp. - As of right now, the tracker doesn’t send “exit” events to the Tinybird data source, so session duration is defined as the time of entry to the time of the last pageview. This is fine for now.
- The
argMin()andargMax()are some really useful ClickHouse functions that allowed me to get the URL at the minimum (entry page) and maximum (exit page) timestamp within the session. - Each pageview has a referrer, but to get the session referrer, I again used
argMin()to get the referring URL to the entry page. - The ClickHouse
groupArray()function let me retain all the URLs in the session in a single column, which is nice.
Step 1B: Materialize it!
Because I planned to reuse this session data often, I created a materialized view called session_data_mv from the above result. As new pageview events are sent to Tinybird, this materialized view incrementally aggregates session data that I can query later. This means better performance, and also less time for me to spend rewriting SQL.
Step 2: Define the upper widgets with a parameterized timespan
With session data in hand, I could then turn to the widgets themselves. My plan was to create a Tinybird Pipe with the results for each of the top 4 widgets in a single node (query). I could then publish the node as an API to be consumed by Retool.
Here’s the SQL I wrote to get all of the top widgets in a single Tinybird Pipe:
Notes:
uniqExact()is a ClickHouse function similar tocount(distinct column)in vanilla SQL.- I used the vanilla
count()instead ofuniqExact()for the sessions because each session ID in thesessions_data_mvview will be unique by definition. countIf()is a nice ClickHouse function to use as an alternative to something likesum(case when pageviews = 1 then 1 else 0 end).- I’ve used Tinybird templating language to define two query parameters that will set the timespan in the resulting API:
start_datetimeandend_datetime. Theif defined()function in the templating language lets me set theend_datetimeparameter as optional, and exclude theANDstatement if it isn’t defined.
Step 3: Get data for the chart
The chart widget adds a fun challenge, in that it should display time series data for whichever top widget is selected over the timespan.
Here’s how I did that. First, I nearly repeated the same query as for the prior step, but aggregated the data by day:
Then, I created an additional node in the Pipe to get data from the column that I wanted:
Notes:
cameron_ga_chart_0is the name of the prior node containing the SQL just above. This is the beauty of Tinybird Pipes: composable, chained SQL nodes!- This is made possible by the
column()function in the Tinybird templating language. I can select which column I want to get data from by passing a query parameter. The default is unique visitors.
Step 4: Visualize it in Retool!
Retool is a really nice platform for visualizing data for internal teams, and I have found it incredibly useful as a Content Marketer for my own internal analytics views. I’ll be using it in these blogs to quickly recreate all of these Google Analytics visualizations.
Before I jumped into Retool though, I needed to turn my Tinybird Pipes from Steps 2 and 3 into API endpoints.
This is a single click in the Tinybird UI:
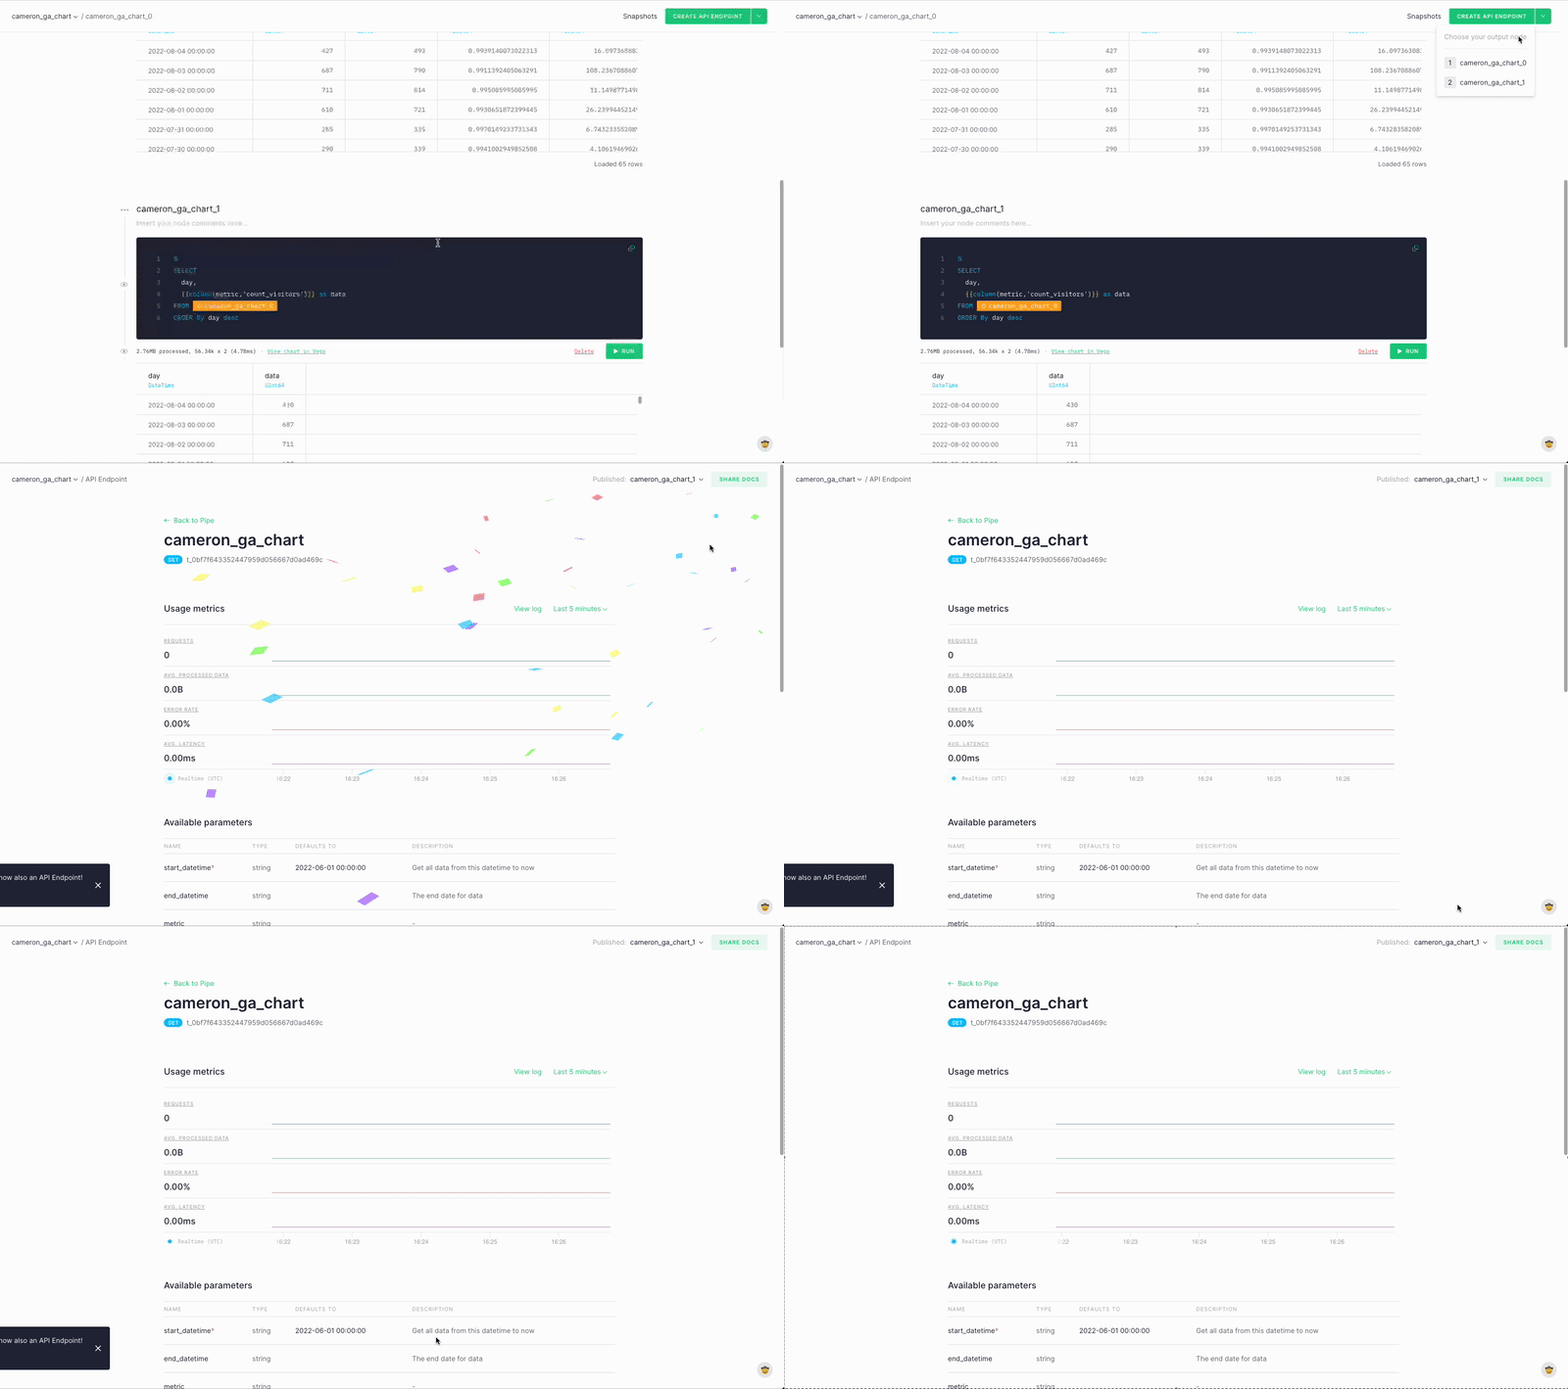
With the endpoints created, I could then move on to visualizing in Retool.
Adding the Tinybird API as Retool resource queries
The first thing I needed to do in Retool was create the resource queries that would request data from the Tinybird endpoints. I needed 3 of these:
- One to get widget data for the selected time period
- One to get widget data for the prior time period (for the +/- indicators)
- One to get chart data for the selected time period
Here’s what #1 looks like in Retool:

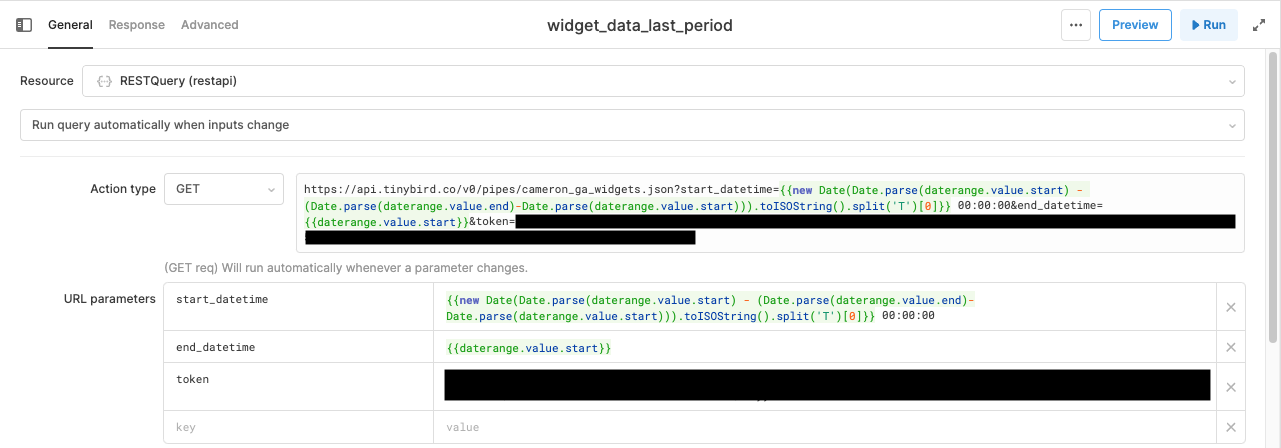
You can see that I’m making a GET request to the Tinybird Pipe endpoint I created with a start_datetime and end_datetime query parameters, plus my token (obscured) to read that Pipe. The other 2 resource queries look very similar, and I’ll explain some of the differences in a bit. For now, I just have placeholders for start_datetime and end_datetime. I’ll update those once I create the date range picker.
Date range picker
To recreate the date range picker for this proof of concept, I’ve used Retool’s prebuilt datepicker input, which is essentially just a React datepicker component. Super easy. I don’t get the preset ranges that Google Analytics has, but that’s fine with me for now.
This datepicker will serve the inputs I need for the start_datetime and end_datetime query parameters in the Tinybird API endpoints I previously created.

Then I updated the URL parameters in my resource queries to use these selectors:

Getting the previous period date range
I created two resource queries for the widgets, both of which make a request to my widgets endpoints in Tinybird, but with different time parameters. The first one is for the current time period, and the second for the previous time period, so I can show those cool green and red arrows that indicate whether or not my metrics are moving in the right direction.
For my previous period resource query, the end_datetime parameter was pretty easy, just set it to daterange.value.start — that is, the end of the previous period is the same as the beginning of the selected period.
The start_datetime was a little trickier. I had to calculate the length of the selected period and subtract that from the start of the selected period (daterange.value.start). Since the datepicker returns String data types, I had to parse those into dates, do the math, and then turn them back into Strings.
Here’s that little bit of JavaScript:
So this is what the URL parameters looked like on the resource query for the previous period after I figured that out:
Creating the widgets
With the resource queries set up in Retool, my next task was to actually create the components! I started with the widgets up top.

The Retool “Statistic” component is a perfect fit here because it natively includes those little +/- red and green trend arrows.
Here’s the implementation for the Visitor Count widget in Retool:
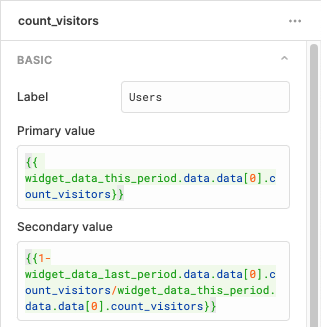
The primary value is the actual metric, and it’s displaying the value associated with the count_visitors key in the JSON data returned by the Tinybird Endpoint. The secondary value is the +/- represented as a percentage.
I applied this exact same logic across all 4 widgets, just changing the JSON key in the template.
And here’s how they look in Retool!

Creating the chart
Implementing the basic chart was super simple in Retool. I just dragged in a Chart component and created a dataset based on the data returned by the resource query that I created earlier. This is one thing I really love about Retool. I didn’t have to futz around with a UI library (though I could have edited the Plotly JSON if I had wanted to). All I had to do was get the value associated with the data key in the JSON returned by the Tinybird API, and - boom - I have a functioning chart visualization in Retool. Huge time saver.
The trickier part of this was updating the chart based on which metric is selected. Fortunately, Retool makes that pretty easy with its “temporary state” component. I created a temporary state in Retool called chart_select. Then, for each of the widgets I added an Event Handler that sets the temporary state to the name of that widget when that widget is clicked:
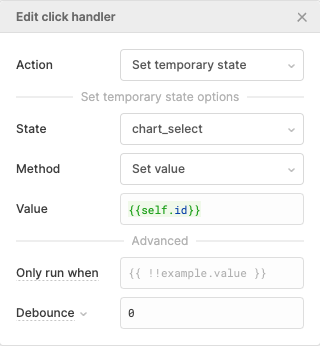
I made sure that the ID of each widget matched the column names so that I could get the right data using the “metric” query parameter I created in Step 3, which defines the column I return from my Tinybird Pipe to populate the data in the chart.
Then I updated that URL parameter in the Retool resource query as follows:
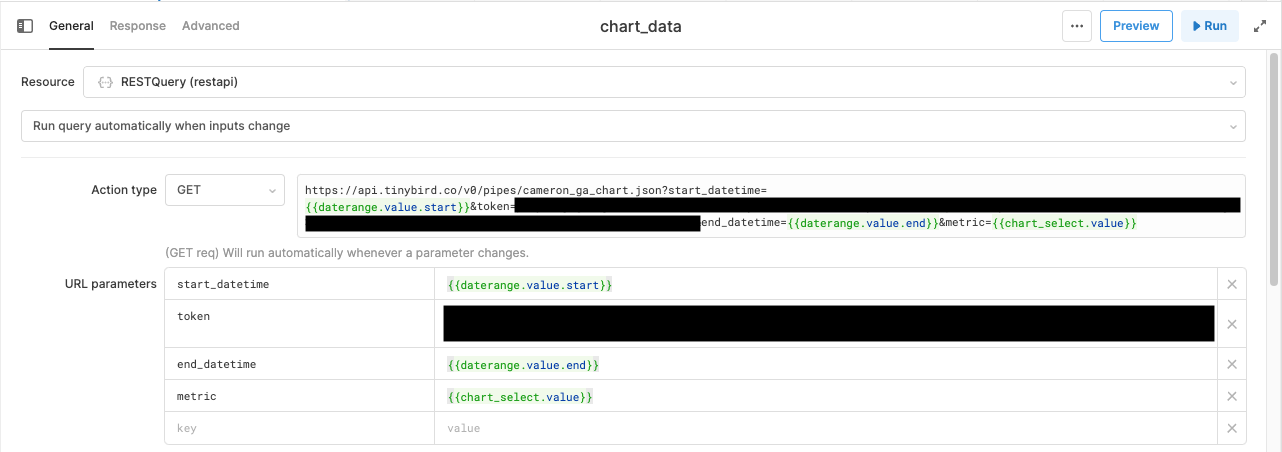
And that’s it! Here’s how it actually looks now that it’s fully implemented:
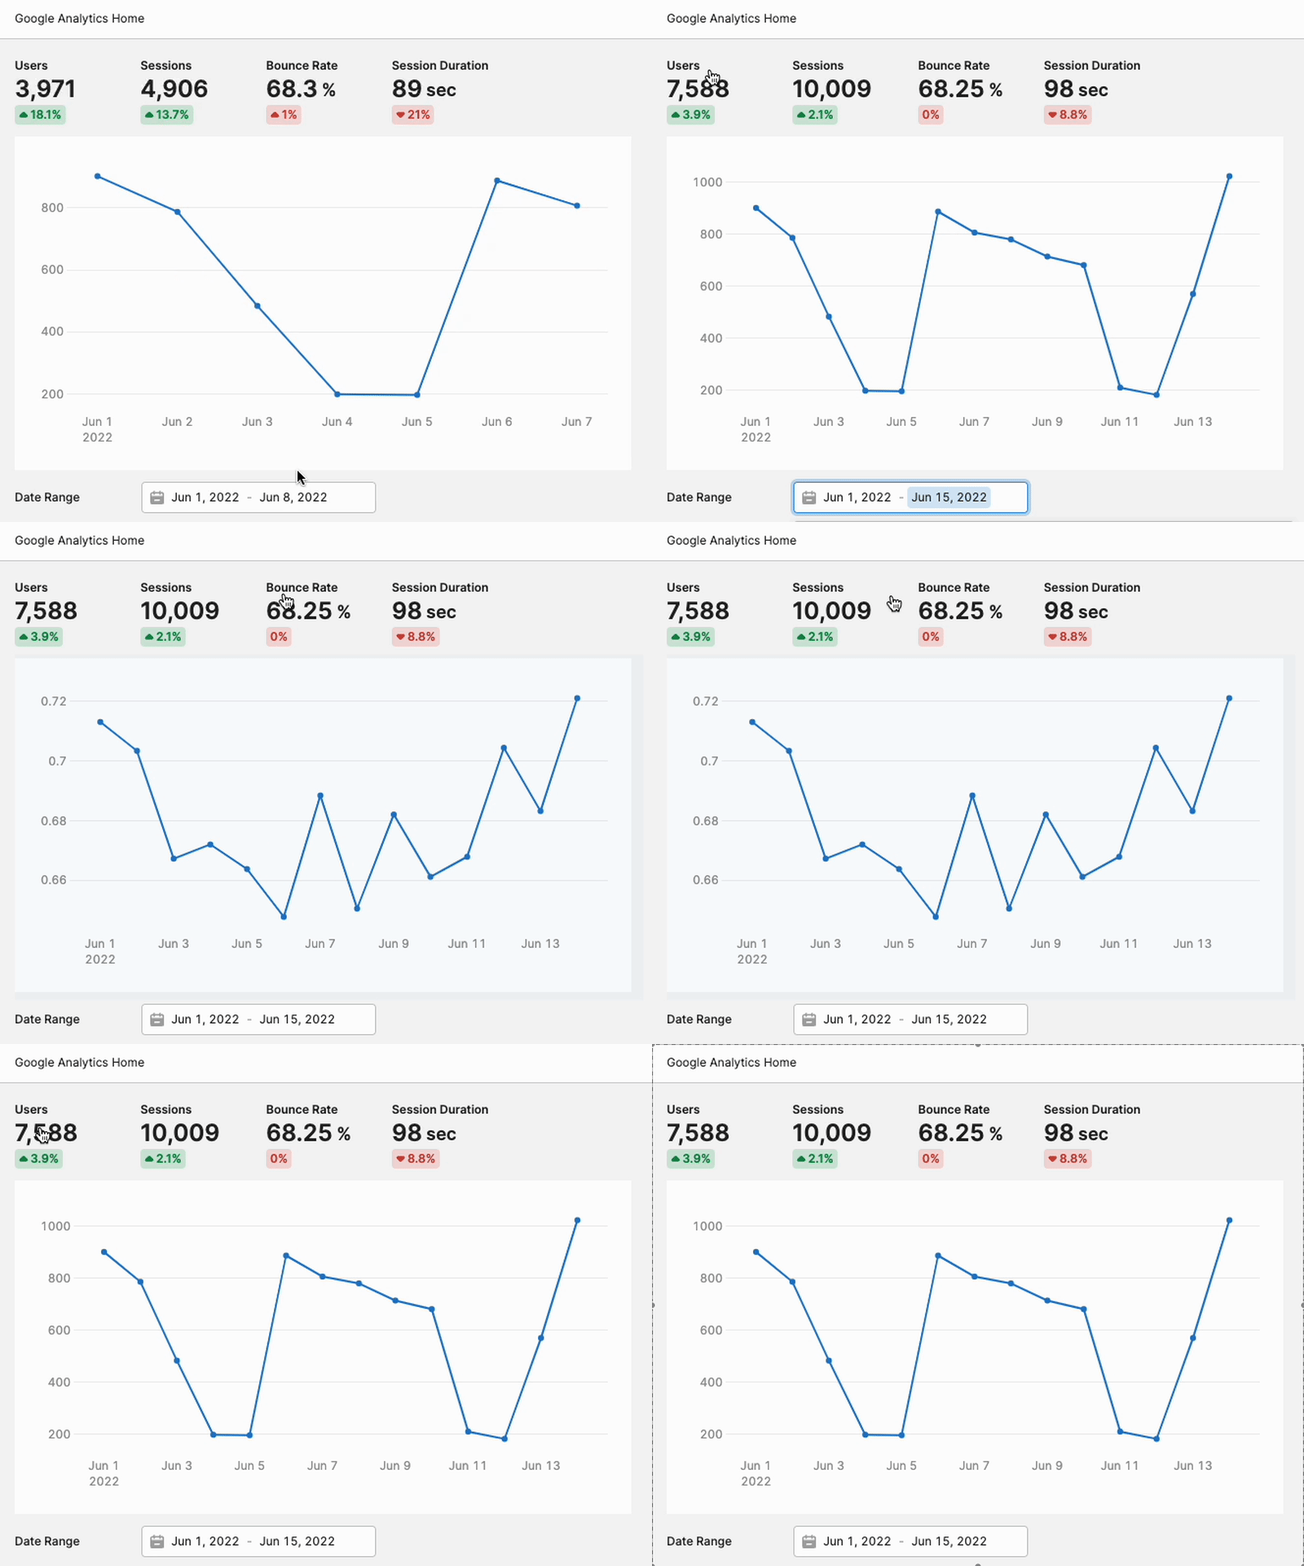
Almost a perfect copy of the original, thanks to Retool! :)

