Amazon Simple Storage Service (S3) is a widely adopted object storage service that offers scalability, durability, and cost-effectiveness for storing and retrieving data. It’s a popular choice for organizations of all sizes to store vast amounts of data, including structured, semi-structured, and unstructured data. Today, we are thrilled to announce the launch of the S3 Connector, allowing you to easily ingest data from Amazon S3 into Tinybird, where you can easily build, publish, and share near-real-time analytics over your S3 data.
The Tinybird S3 Connector makes it easy to sync files in S3 to Data Sources in Tinybird, where you can query the data with SQL and publish low-latency analytics APIs.
Why Amazon S3?
When we launched Tinybird several years ago, we started with the most simple form of data ingestion possible: CSV files. The idea was to make it possible to ingest a large amount of file-based data so you could query it online with SQL and publish low-latency APIs to use in real-time analytics use cases.
Since then, we’ve added many more connectors for streaming sources like Apache Kafka and Confluent Cloud and data warehouses like BigQuery and Snowflake.
In a way, building the S3 Connector is like coming back to our roots, but massively optimized for more power and simpler setup for data engineers and software developers utilizing the world's most popular cloud storage service.
S3 provides durable, inexpensive, and highly available cloud storage for files hosted on Amazon Web Services (AWS). S3 intelligent-tiering and S3 storage classes optimize pricing for long-term, file-based storage, making it ideal for long-term big data retention or data lake implementations.
However, AWS S3 is not a good storage layer for user-facing analytics, as its underlying technology and pricing model were never meant to handle the real-time data processing and low-latency requirements that these cases demand.
Amazon S3 is great for cheap, long-term storage. But it is not a good storage layer for user-facing analytics, where data freshness and low latency matter.
As with our data warehouse connectors, our focus with the S3 Connector was to make it simple and efficient to surface datasets in S3 onto a platform designed for building real-time data analytics.
Introducing the Amazon S3 Connector
To bridge the gap between Amazon S3 and real-time analytics, Tinybird introduces the Amazon S3 Connector. This first-party connector optimizes the process of ingesting data from files in Amazon S3 into Tinybird, enabling you to query and shape the data using SQL and publish high-concurrency, low-latency analytics APIs that you can integrate into user-facing applications or power real-time business intelligence dashboards.
With the intuitive UI and CLI workflows provided by the Amazon S3 Data Source Connector, you can easily schedule data ingestion from Amazon S3 into Tinybird. This automation eliminates the need for third-party infrastructure to manage sync jobs, simplifies configuration, and streamlines your data pipeline.
Why should you use the S3 Connector?
Near Real-time Analytics: With the obvious caveat that working with files rarely qualifies as “real-time”, the S3 Connector empowers you to build near-real-time analytics on top of S3 data by moving that data to a platform purpose-built for building and supporting real-time data analytics.
You can leverage the power of Tinybird's SQL interface to join S3 data to event streams and publish real-time APIs from your queries that handle highly-concurrent concurrent requests with minimal latency. With the S3 Connector and Tinybird, you go from files in object storage to fast analytics APIs in a matter of minutes.
Cost Efficiency: You choose S3 because it’s cheap, so why futz around with intermediate systems or bits of compute-eating code to manage ingestion, when you could just use the S3 Connector? With this new connector, Tinybird handles all the real-time data ingestion between S3 and a Tinybird Data Source, so you don’t have to manage any more code, dedicate any more resources, or spend any more on compute.
The Tinybird S3 Connector eliminates "glue code" that would be otherwise necessary to sync S3 files into external analytics systems.
S3 analytics with the S3 Connector
With the S3 Connector, you can rapidly build near-real-time analytics on top of your S3 data using both the Tinybird UI and CLI. Here’s how to ingest files from S3 into Tinybird in either interface.
Using the S3 Connector in the Tinybird UI

Step 1: Connect to your S3 Account
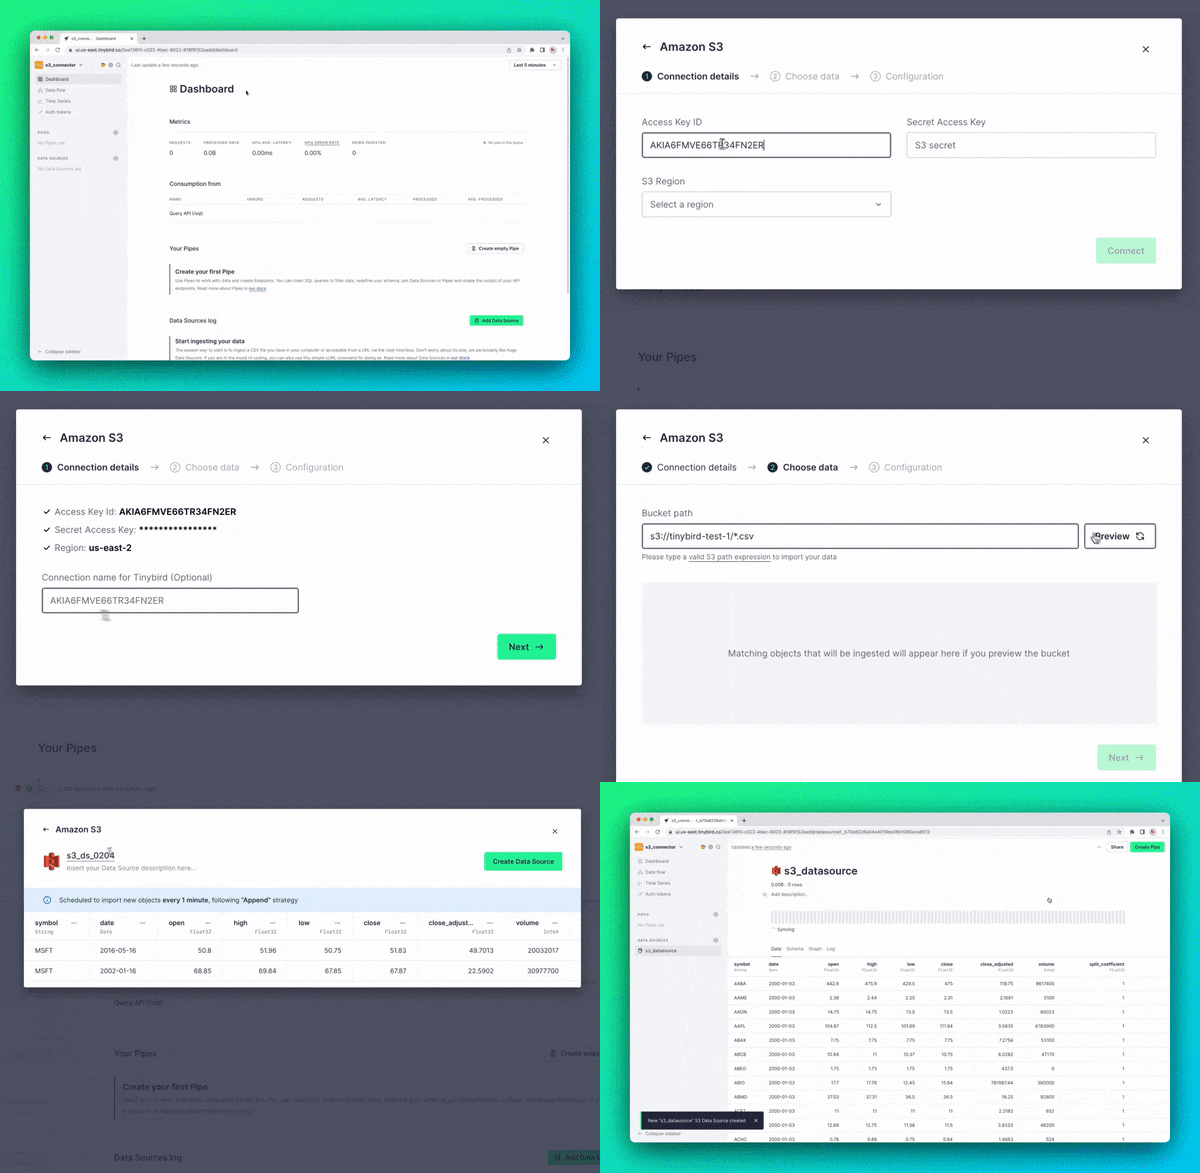
To set up the Amazon S3 Connector, simply navigate to the Tinybird UI, add a new Data Source, and select the Amazon S3 option.
Supply Tinybird with the necessary permissions by entering your Access Key ID, Secret Access Key, and S3 Region. Then, give your Connection a name, and your Tinybird Workspace is now connected to your Amazon S3 bucket.
Step 2. Choose your bucket and file filter
Next, use an S3 path expression to specify which objects Tinybird will be able to access in your S3 bucket. The S3 Connector supports ingestion of .csv, .ndjson, and .parquet files.
Step 3. Define your ingest frequency
Finally, define the frequency with which to sync your files with Tinybird, either On demand or Auto, which runs every minute and ingests up to 5 files per run.
Configure your Data Source as you would any other Tinybird Data Source, providing a name and description and modifying the schema as necessary.
Using the S3 Connector in the CLI
More of a keyboard junkie? Use the Tinybird CLI to set up your ingestion. Create a new S3 Connection with tb connection create s3, supplying the necessary credentials, and then append the following lines to any .datasource file to create a Data Source from that connection:
Use SQL to publish S3 analytics APIs
Once you’re data has landed in a Data Source, your analytics are bounded only by the (expansive) limits of SQL. Use Tinybird Pipes to filter, aggregate, and join your Amazon S3 data, building high-performance analytics APIs that you can share across your team.
Once your S3 data is in Tinybird, you can write SQL to filter, aggregate, and join it, then publish your queries as low-latency APIs.
For more information on building S3 analytics with Tinybird, watch the screencast below.
Monitoring and observability with the S3 Connector
The S3 Connector is fully serverless, requiring no additional infrastructure setup. It provides built-in observability, monitoring, and performance metrics to ensure a robust and performant data ingestion process from S3.
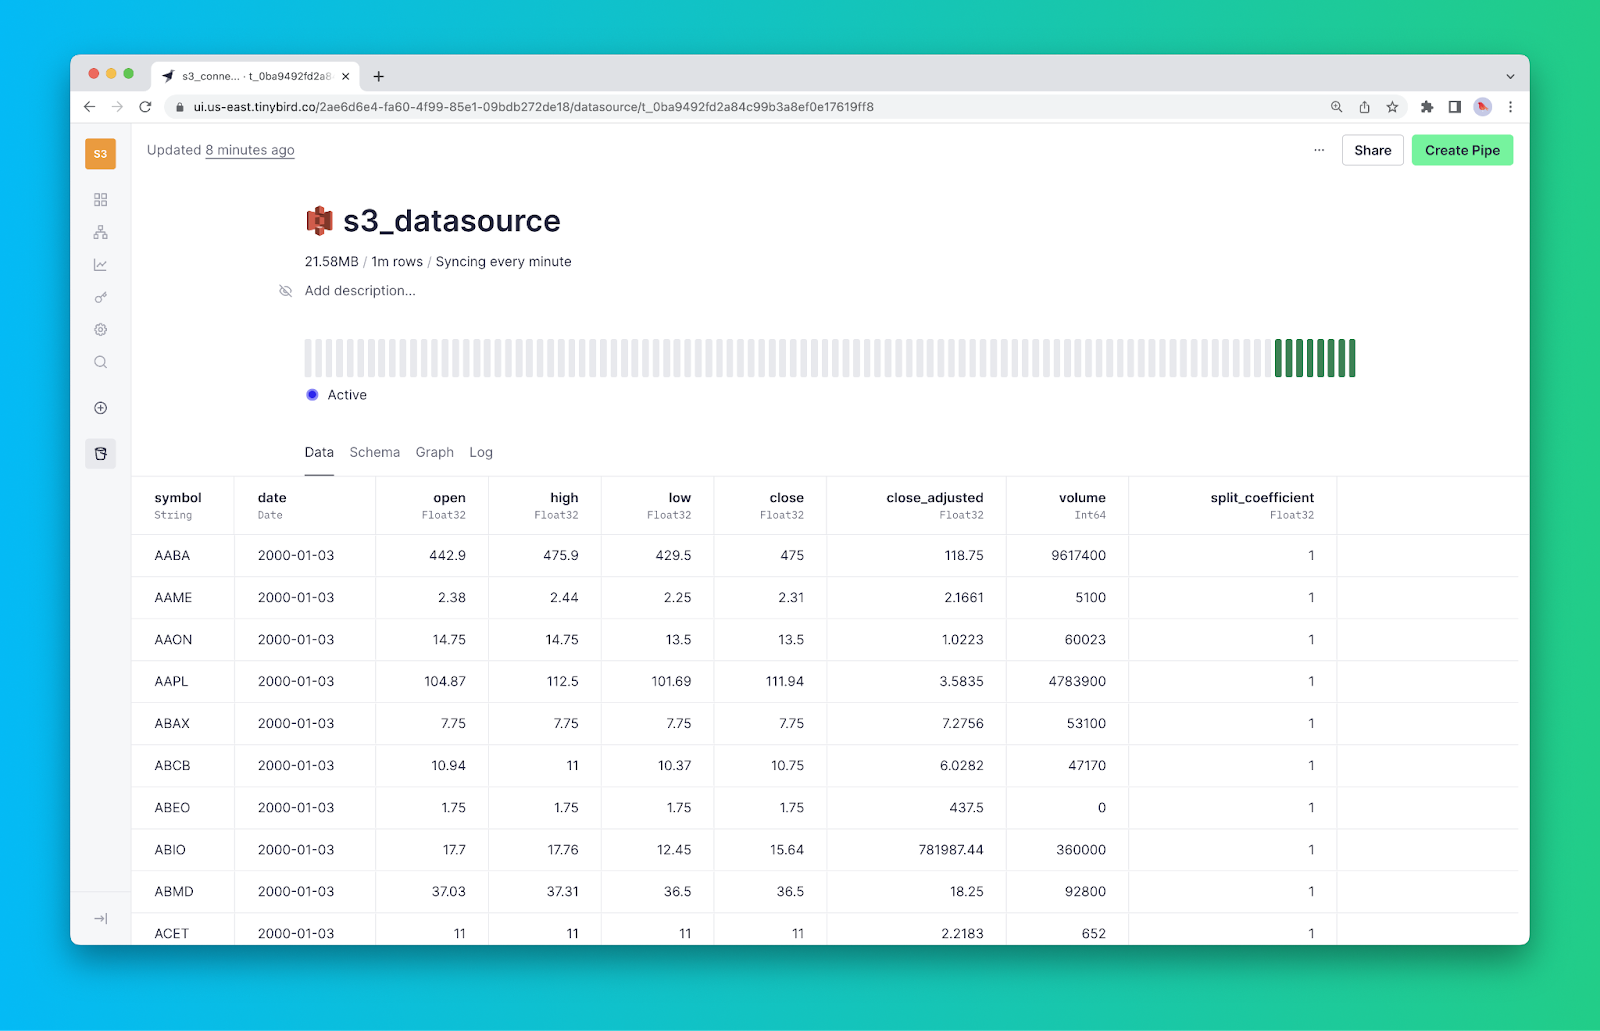
You can monitor your sync jobs using the pulse chart in the Data Source detail view, which displays the execution status of the last 50 sync jobs.

Furthermore, Tinybird offers a rich set of logs and detailed monitoring capabilities within the Data Source view. You can leverage the Tinybird Service Data Source datasource_ops_log in your Tinybird Pipes to publish custom observability metrics as APIs. This allows you to monitor your Amazon S3 sync jobs using your preferred external observability tools.
Get Started with the Tinybird S3 Connector
Want a more complete tutorial for building analytics with the S3 Connector? Watch the screencast below or check out the documentation.
Ready to start building analytics over Amazon S3 data? Start by signing up for a Tinybird account. The Build Plan is free, with generous free limits and no time restrictions.
If you have questions about the S3 Connector, any other Connector, or Tinybird in general, please join our active Slack community and bring your questions, concerns, and feedback.


