Optimizations 101: Detect inefficient resources
This guide shows you how to find your most inefficient resources - typically the slowest API Endpoints, and the ones processing the most data.
Prerequisites
You don't need an active Workspace to understand this guide, but it can be useful to have one open to compare and apply the ideas to your own situation.
1. Orient yourself with the Overview
First, navigate to the Overview page of your Workspace:
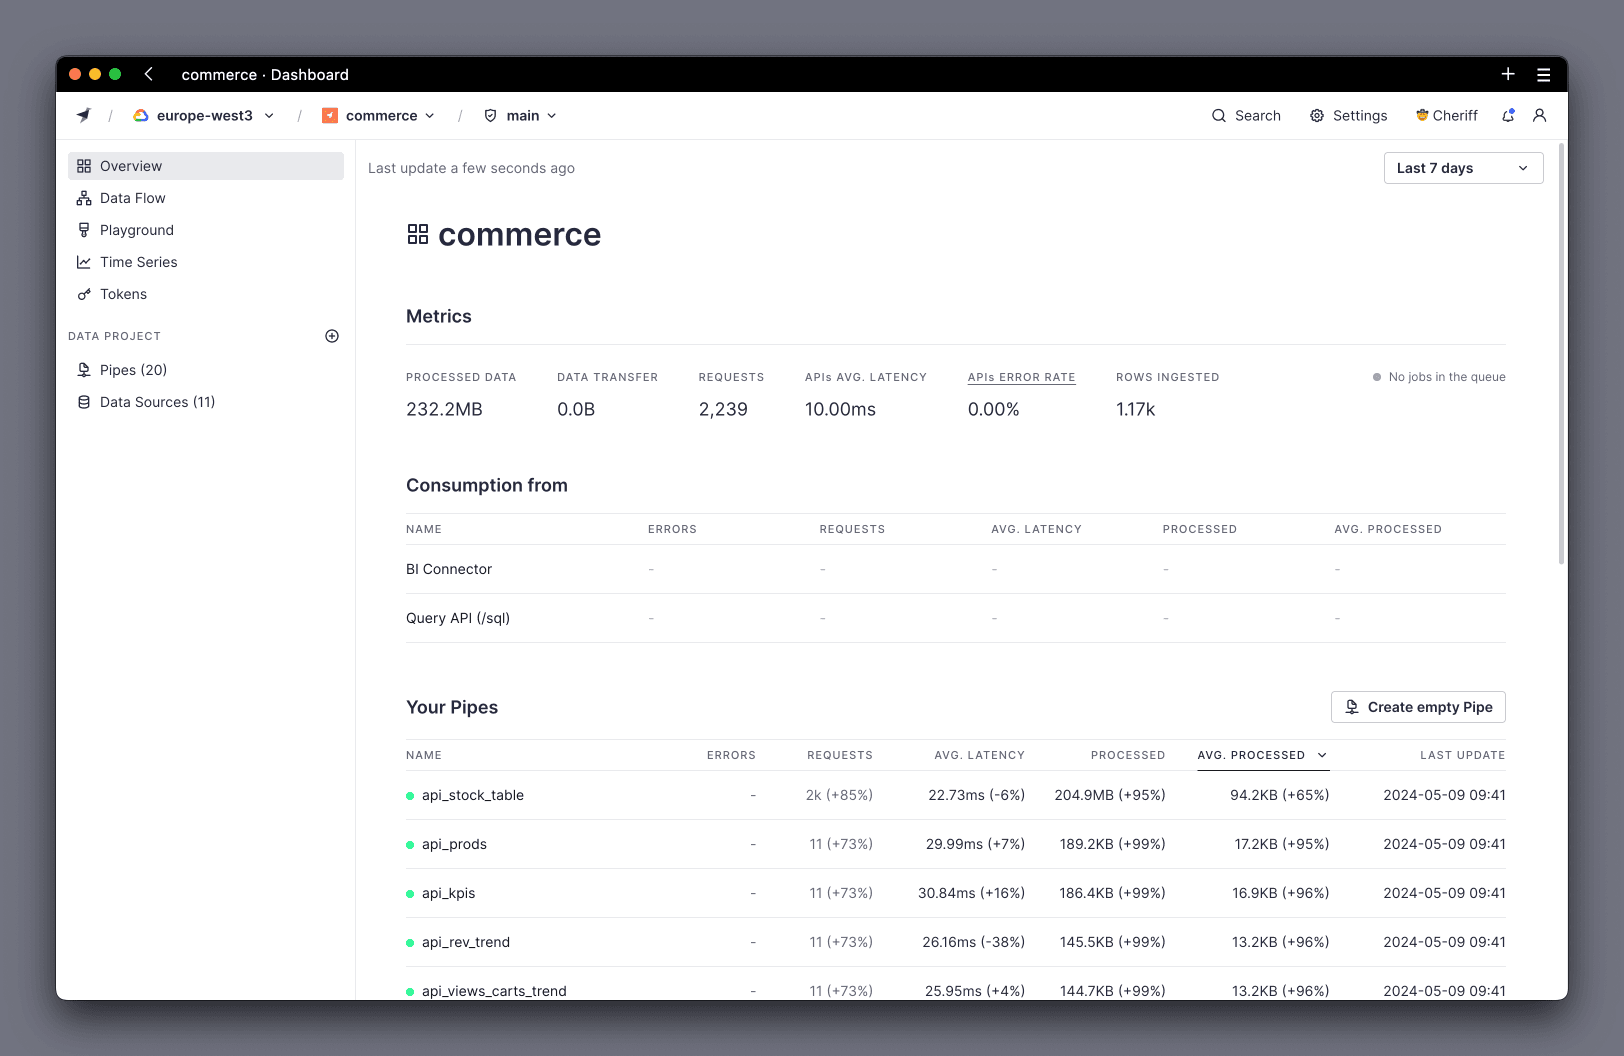
To find the slowest API Endpoints:
Set the period to show performance information using the top right dropdown:
- Try to cover a large period for a good average.
- If you've made changes recently, try to only include the period for the current version, to make sure you're analyzing the performance of the new version.
Then use the different Consumption summaries to examine your usage:
- Query API for direct API queries.
- Pipes for transformations and Materialized Views.
Check the dedicated Pipes section:
- In Pipes, you get a view of the total number of requests over the period, the average latency, the total data processed for that Pipe, and the average data processed.
- Sort by
Processedto bring the Pipes processing the most data over the period to the top. This effectively shows which Pipe is the "most expensive" and gives you a list of where to start your investigations. Additionally, you can sort byavg. latencyif you're interested in finding the slowest Endpoints. Consider that the columnrequestsvalue can help you decide which Pipes to optimize, because you could ignore Pipes with few requests. - Finally, select the name of a Pipe to open it in the UI for further investigation.
2. Analyze a Pipe Endpoint
When you open up a Pipe in the UI, you have a few different options to gain insights into its performance:
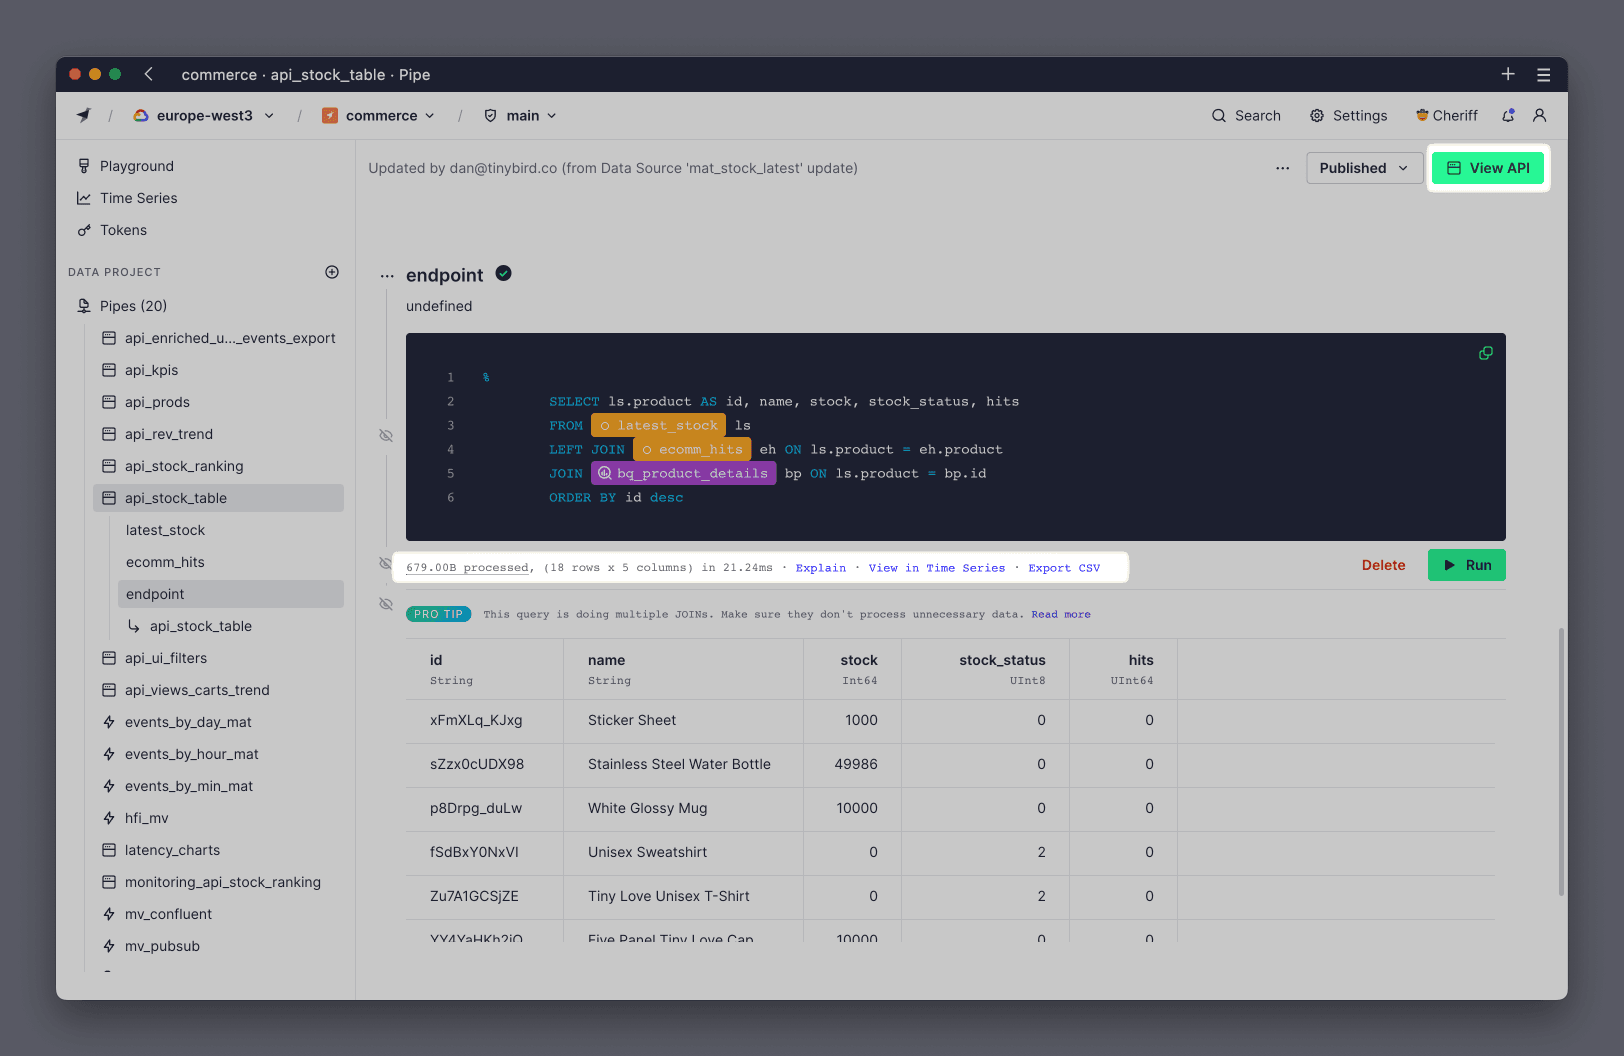
The View API button (top right corner) takes you to the Pipe's performance and testing page.
Under each node in the Pipe, there's performance information about the query that node is running (processed bytes, rows, columns, time).
Note that these node performance metrics are from executing the query with a LIMIT 20, so may give you smaller results unless the query reads all the rows for processing. You can modify the query in the node to force it to process all the data, such as by hashing a column or forcing a count of all rows. By doing this, you'll have a clear indication of data processed and time execution.
If you select Explain under any Node, you'll see how the nodes are integrated into the query that is run through the engine:
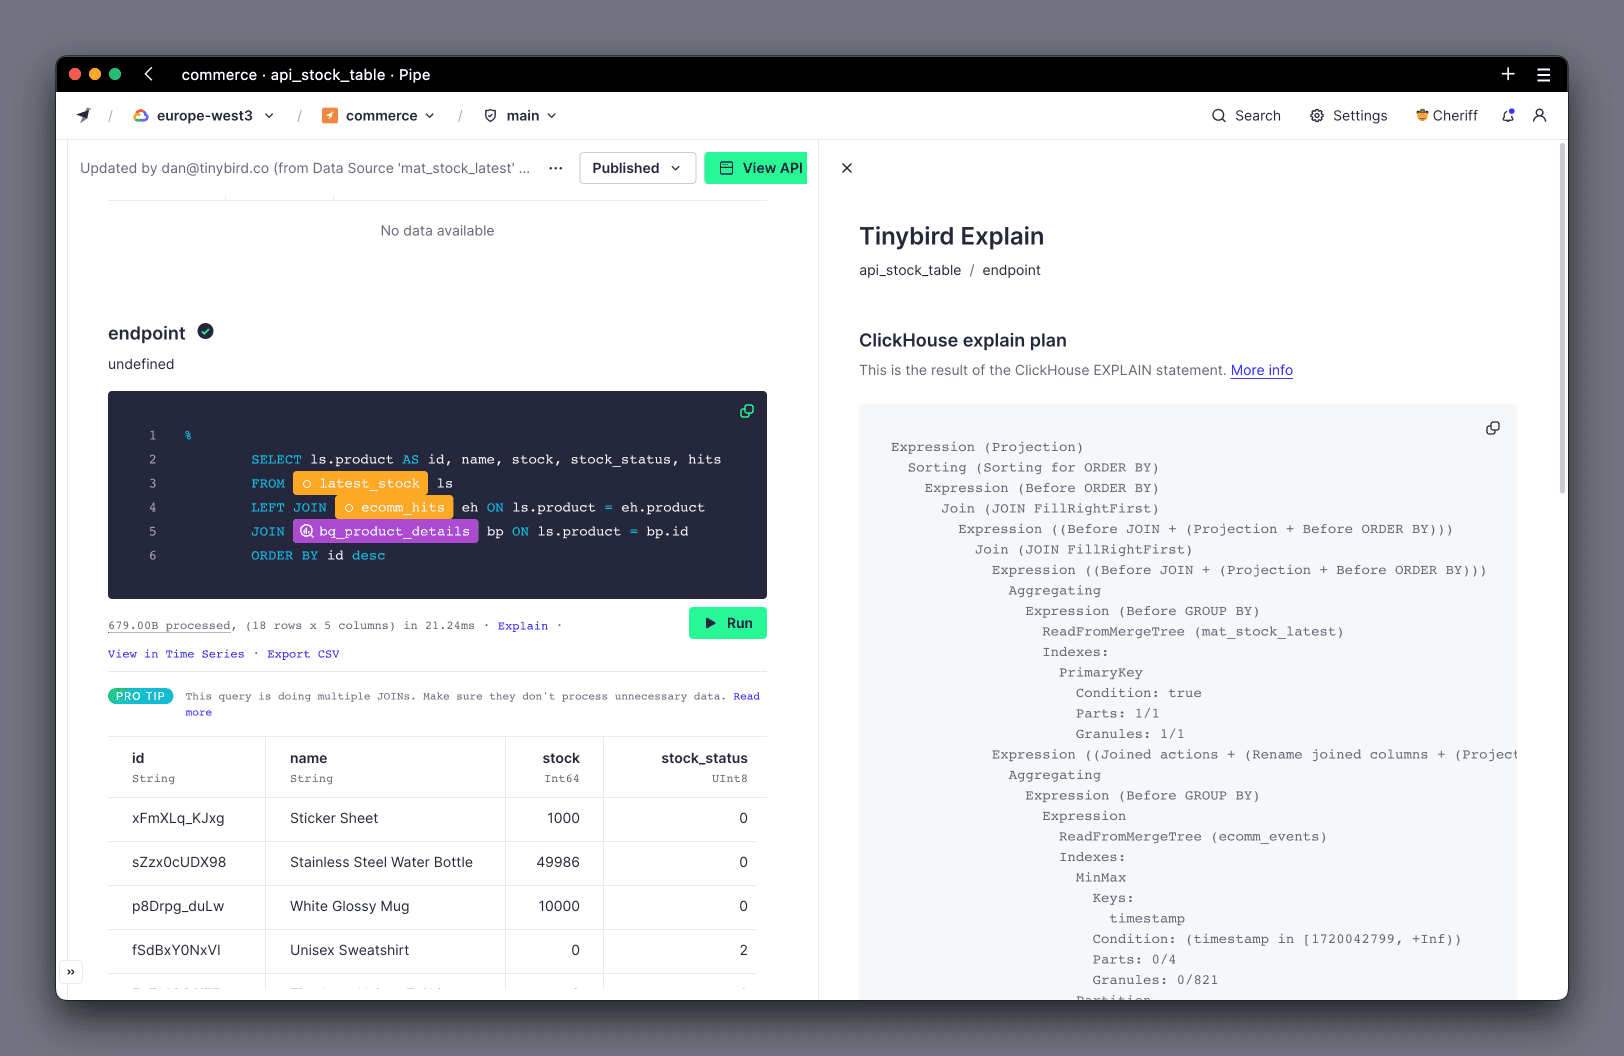
This can be a very good way to spot if you're making a common mistake, such as not filtering your data before you aggregate it. These common mistakes will be explained later.
The node with the tick icon is the one published as the Endpoint:
The performance metrics under this node are still shown with LIMIT 20. Open the View API button (or just select the tick icon) to bring up the Endpoint performance page for further analysis.
3. Use the View API Performance page
Coming from the View API button from the Pipe page, you'll go to the Endpoint page.
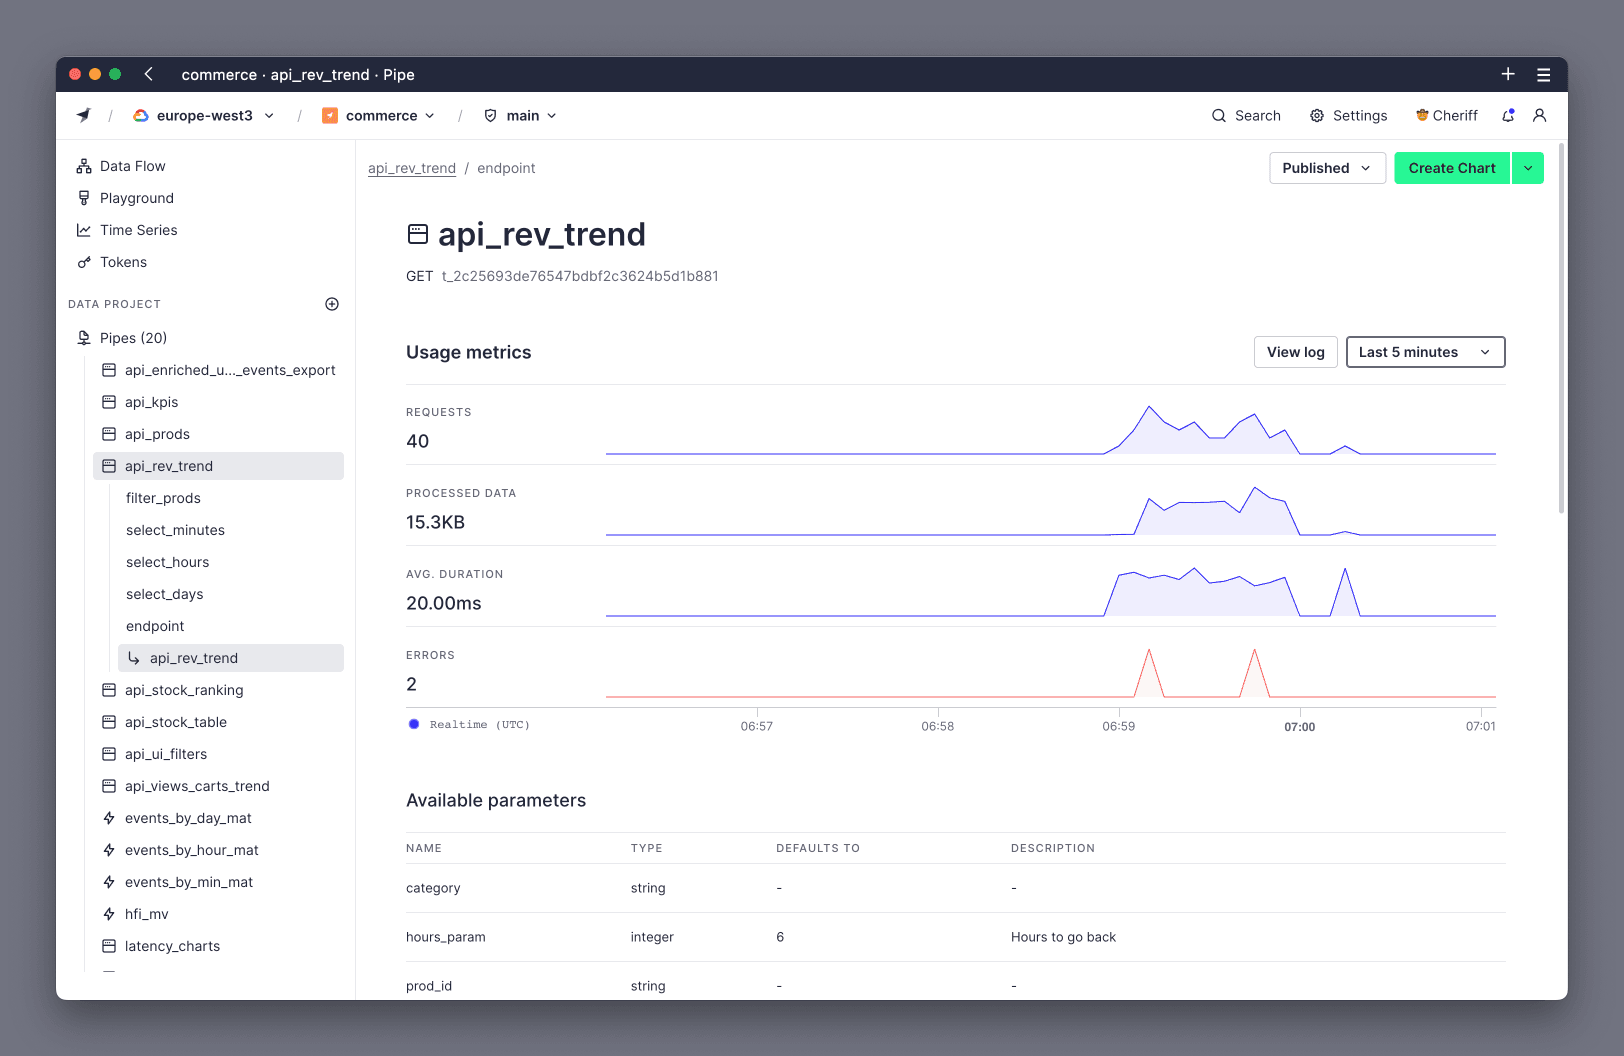
Here you can see the specific performance metrics of this Pipe as it's called by your application. This is a good place to see if there's a lot of variance in requests (in other words, to check if the performance of the Endpoint changes with time for any reason).
Towards the bottom of that page, you see the sample snippets:
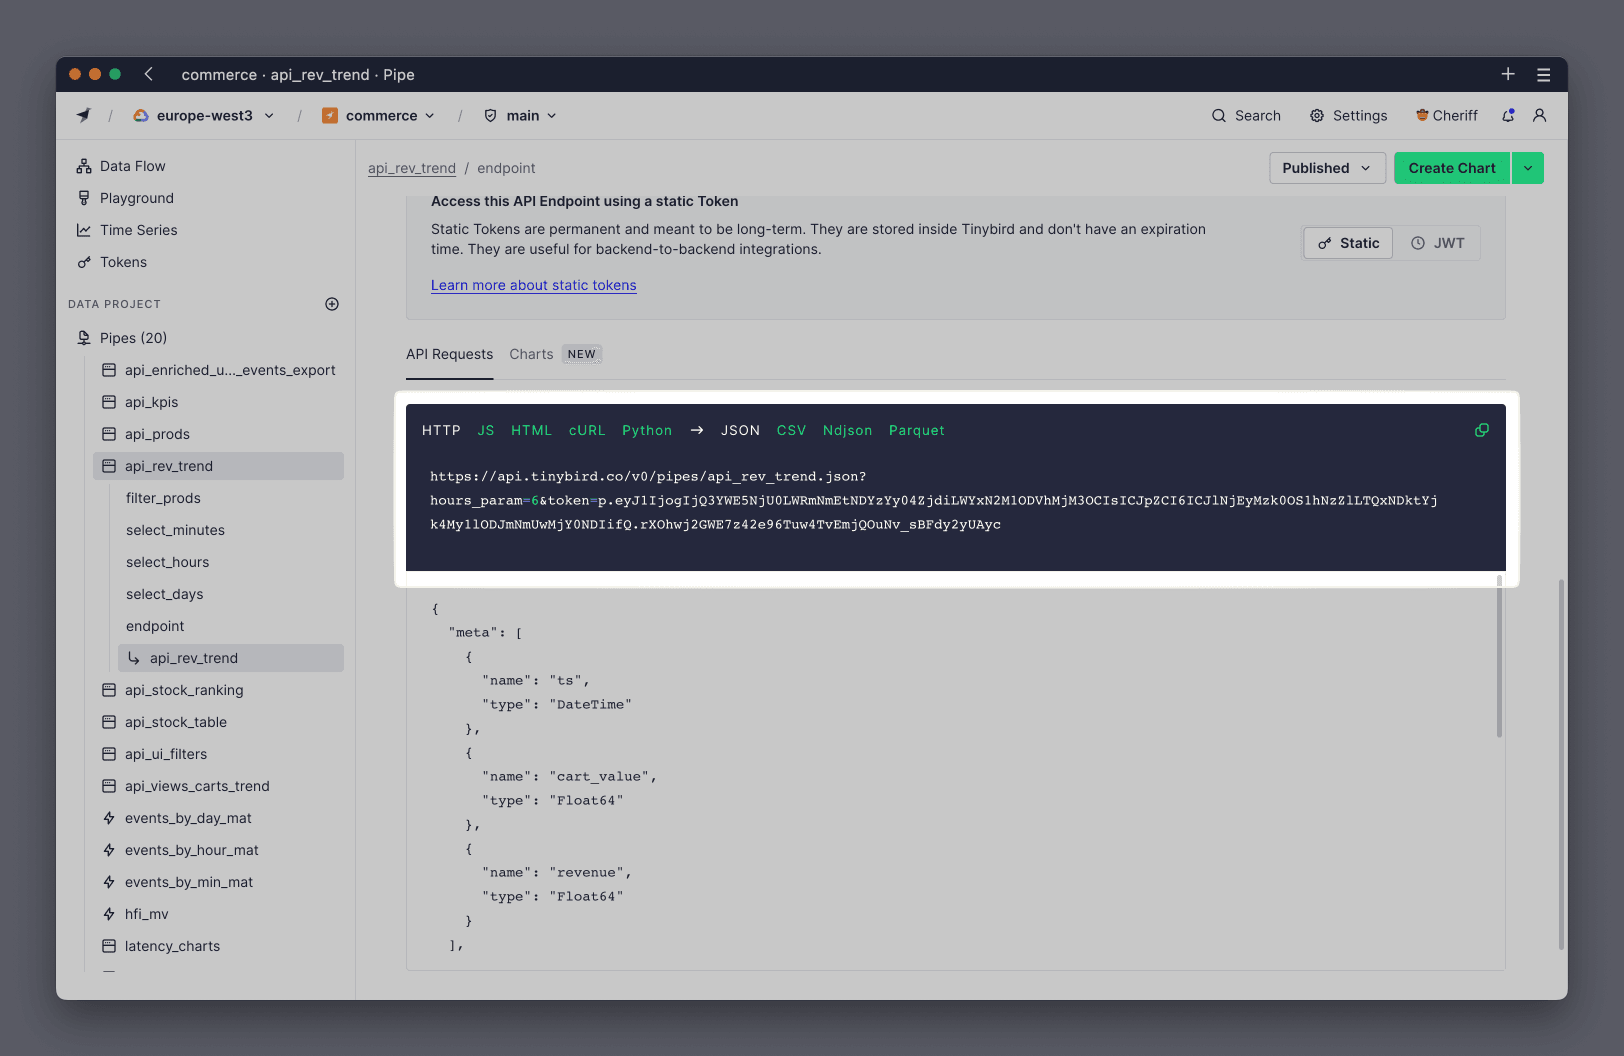
You can copy this sample code and run it in a new browser tab. This executes the query exactly as your application would, and the performance metrics will be recorded and reported to you on the Endpoint page. This allows you to see the exact impact of any changes you make to your Pipe.
4. Use params to find common Pipe usage patterns
You'll need to be familiar with dynamic parameters and Service Data Sources for the next 2 sections.
Once you have a dynamic API Endpoint with parameters in use, it can be really useful to observe common parameter patterns from the application (for instance, which parameters and values force the Endpoints to process more data). You can then use these observations to drive new optimizations on the Pipe, such as ensuring that a column that is commonly used as parameter is in the sorting key.
Use the pipe_stats and pipe_stats_rt Service Data Sources. You can also explore some common Pipe usage queries in the Monitor API performance guide.
Specifically, you can execute the following query to get the number of requests, average processed data, and average duration of your API Endpoints and parameters in the last 24 hours:
check pipe_stats_rt
SELECT
    pipe_name,
    parameters,
    count() AS total_requests,
    formatReadableSize(avg(read_bytes)) AS avg_read,
    avg(duration) AS avg_duration
FROM tinybird.pipe_stats_rt
WHERE start_datetime > now() - INTERVAL 1 DAY
GROUP BY pipe_name, parameters
ORDER BY total_requests DESC
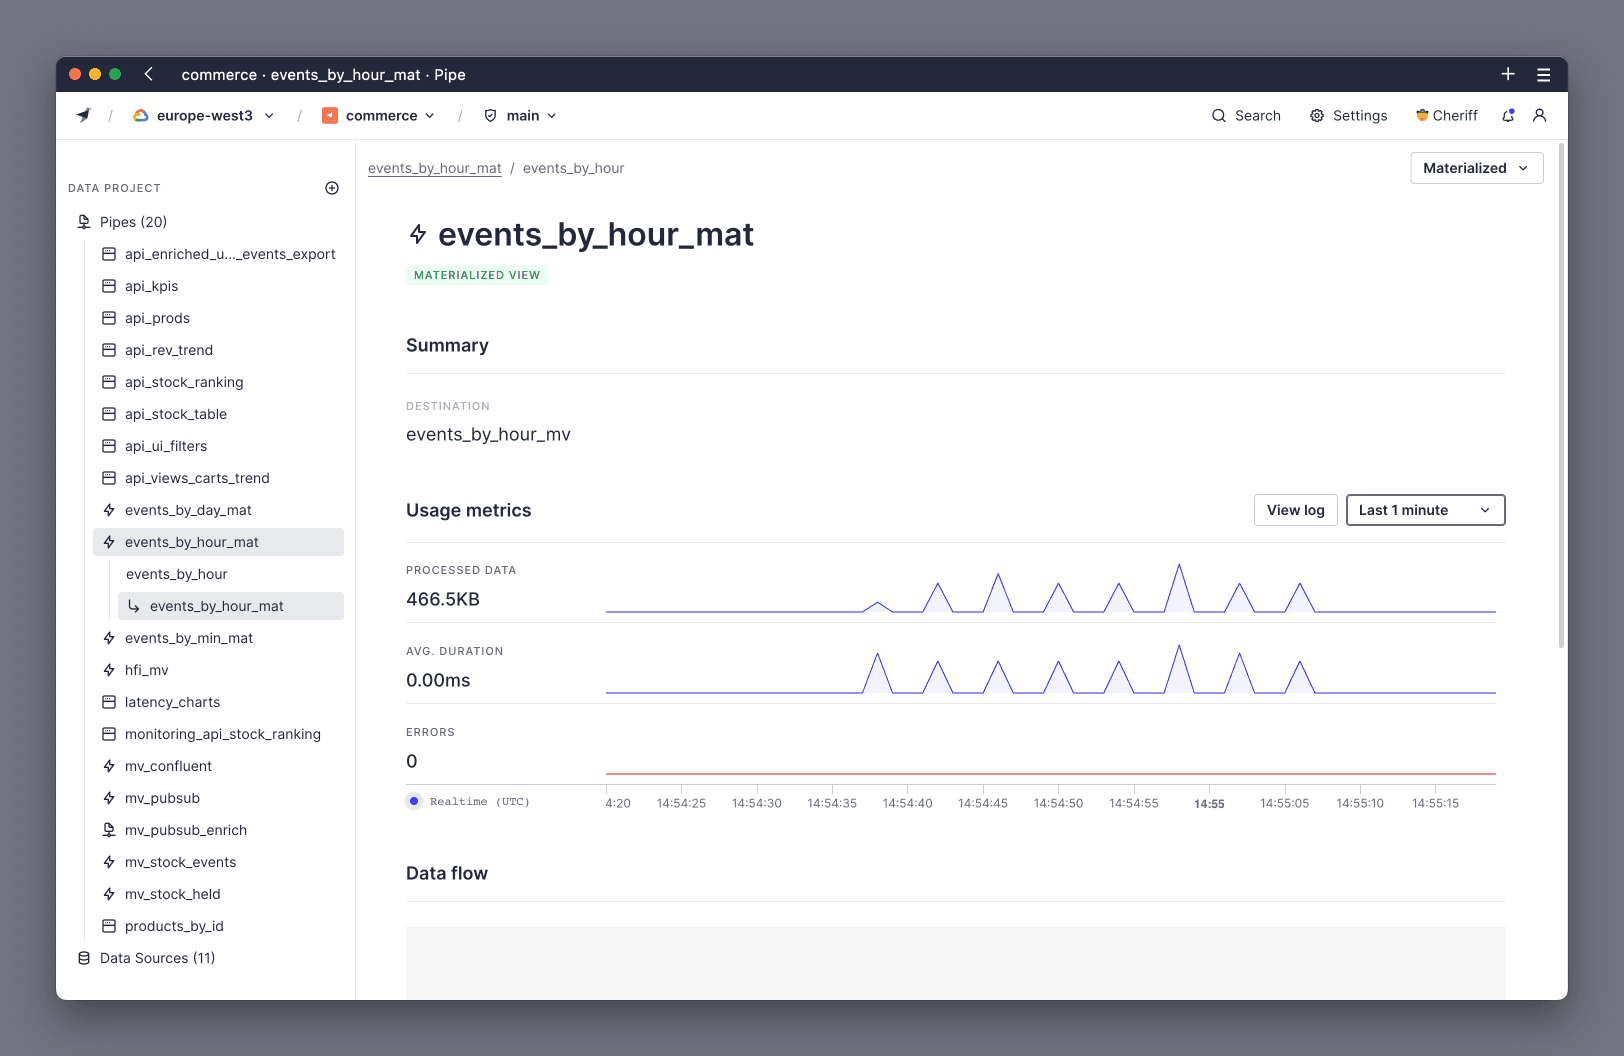
5. Measure Materialized Views and Copy Pipes performance
You should also check the Pipes that move data from one Data Source to another, like Materialized Views and Copy Pipes. You can track them in tinybird.datasources_ops_log and in the Materialized View page or Copy page.
check processed data for data source operations
SELECT
  datasource_name,
  formatReadableSize(sum(read_bytes) + sum(written_bytes)) AS f_processed_data,
  formatReadableSize(sum(read_bytes)) AS f_read_bytes,
  formatReadableSize(sum(written_bytes)) AS f_written_bytes,
  round(sum(read_bytes) / sum(written_bytes), 2) AS f_ratio
FROM tinybird.datasources_ops_log
WHERE
  timestamp > now() - INTERVAL 1 DAY
  AND pipe_name != ''
GROUP BY datasource_name
ORDER BY sum(read_bytes) + sum(written_bytes) DESC
Pay special attention to Materialized Views with JOINs, since they are prone to scan more data than needed if your SQL isn't optimized. Basically, JOINs should be with subqueries of pre-filtered data.
Next steps
- Read Optimizations 201: Fix common mistakes.
- Check out the Monitoring docs and guides for more tips, like using Time Series to analyze patterns.
- Explore this example repo to analyze Processed Data. It may not be 100% accurate to billing, as Tinybird tracks certain operations differently in Service Data Sources, but it's a great proxy.