


What is a leaderboard?
Leaderboards are a visual representation that ranks things by one or more attributes. For gaming use cases, commonly displayed attributes include total points scored, high game scores, and number of games played.
But leaderboards are used for far more than games. For example, app developers use leaderboards to display miles biked, donations raised, documentation pages visited most often, and countless other examples where there is some user attribute that can be ranked to compare results.

As users complete some ‘level’, completing a game or completing some task for example, an event is created and posted to the app’s backend, where the data is stored. When triggered by a user event, the event data are retrieved and analyzed, in this case sorted and ranked, to generate the results. Finally, there is a publication layer that makes it possible to render the leaderboard in the user’s interface. This ‘client display of server-side-generated content’ can generally be referred to as embedded analytics or user-facing analytics, and there are many ways to accomplish it. The most common method is applications designed to make an API call to a server to retrieve fresh data, and then render the results locally on the client.
Building leaderboards involves collecting and storing new data, sorting and ranking it, and making the data sets available to your users. Leaderboards typically leverage a concise data schema with just a user or item name, the ranked attribute, and a timestamp. Ranking algorithms can be based on a single score, time-based metrics, or weighted combinations of factors.
Leaderboards can have different scopes. Some may be completely public across the application. Imagine a game where users share a public leaderboard of top scores. Others may have an “invited-group” scope, where there are team leaderboards. This type of leaderboard is common for customer service and fitness groups. And finally, there are leaderboards that are private for each user, common in finance and education use cases. Regardless of the data visibility required by your application, security, tokens, and row-level security will be part of your design.
Leaderboards are a compelling example of user-facing analytics, but the applications extend far beyond competition and gamification. Real-time data is crucial for the effectiveness of all using-facing analytics, empowering users with the most up-to-date information. For instance, Canva, a design platform, leverages Tinybird’s real-time analytics and developer experience to build features that shows customers live analytics on content views and engagement. Another example is Vercel, a web development platform, which relies on Tinybird to power their real-time user-facing analytics. These features show customers website performance, usage statistics, and up-to-the-second hosting fees.
As data volumes and velocities increase, the challenge is how to ingest that data, process and transform it, and make data sets available in real-time. When building leaderboards in your application, consider methods that allow for real-time delivery of results to many concurrent users.
Why would I want to implement a leaderboard?
When effectively designed, leaderboards can be fun, encourage engagement, and provide motivation.
Leaderboards help you increase user engagement. Real-time updates ensure users see the latest rankings, creating a dynamic and gamified environment. Imagine a fitness app where users compete on a real-time leaderboard for most miles biked in a week. Every ride contributes instantly to their position, motivating them to stay active and check back frequently to see their progress relative to others.
Leaderboards can also improve user experience and positively affect their journey through your digital offerings or web app. In a corporate knowledge base application, a live leaderboard could display the most viewed documentation pages. As users search for information, the leaderboard updates instantly, showcasing the most relevant and popular content. This can guide users towards valuable resources and improve their overall learning experience.
For ecommerce applications, real-time leaderboards can be used internally to track the most viewed products, adjust marketing campaigns and recommendations, and better understand user behavior.
Real-time leaderboards, when implemented thoughtfully, can be a powerful tool in your user-facing analytics design arsenal. They not only enhance user engagement and motivation but can also provide valuable insights into user behavior.
Next, let’s discuss the topic of how to build real-time leaderboards.
Implementing a real-time leaderboard with Tinybird
Tinybird streamlines leaderboard development by providing a scalable platform built to ingest real-time data, query that data in milliseconds, and create API data products.
Tinybird was built to ingest massive volumes of high-velocity real-time data, whether consuming a Kafka stream or supporting real-time transfer via its Events API. As real-time events are ingested, they are written to a serverless data management layer that stores and queries the data. Tinybird’s data layer is based on ClickHouse, an OLAP database designed for working with high volumes of real-time data. Equally important, it can support many thousands of concurrent data requests.
With the game events streaming in, Tinybird Pipes are used to build aggregations and transformations over the data. These Pipes are made up of one or more Nodes, each one containing a SQL query. In the case of leaderboards, the queries are quite simple as they sort and rank the data (see below for example queries).
Once Pipes are configured, Tinybird can publish any Node as an API endpoint with dynamic query parameters. Once you have a data view that you want to share, you can deploy it as a low-latency API data product. In the case of a leaderboard, the Node that produces the ranked data you want to render is published.
Tinybird APIs can be consumed just as any normal REST API. With JWTs for API Endpoints, Tinybird APIs can be consumed directly from within a browser application. Our mission isn’t just to build a fast database, it’s to build a tool that makes YOU fast. Some of our customers are able to build user-facing leaderboards in a matter days, sometimes even hours.
In the following tutorial, we’ll build a simple gaming leaderboard for a Flappybird game.
Adding a leaderboard to a game
In this tutorial, we will add a gaming leaderboard to the Tiny Flappybird game. We know game developers are busy people, and naturally, want to focus on building great games. So spending time deploying a relational database like PostgreSQL, or figuring out how Redis sorted sets work, isn’t time well spent. Tinybird allows a game developer to build a gaming leaderboard on their own in a matter of minutes so you can focus on gameplay.
High-level overview
As users play the game, events are posted to Tinybird using the Events API. These events include ‘score’, ‘game over’, and ‘purchase’. Tinybird ingests these events in real-time and stores them.
Next, a set of SQL queries are designed to retrieve, sort, and rank player scores, and blend in the ranking of the user requesting the leaderboard. These queries are set up in one or more Nodes that define a Pipe for generating the live results.
Once the Pipe is generating the desired leaderboard data, it is published as an API Endpoint. To close the loop, the game is updated to make requests from the ‘leaderboard’ API endpoint in order to render the results in the frontend. When a user triggers a leaderboard request, such as when a game ends, it is based on up-to-the-second game events.
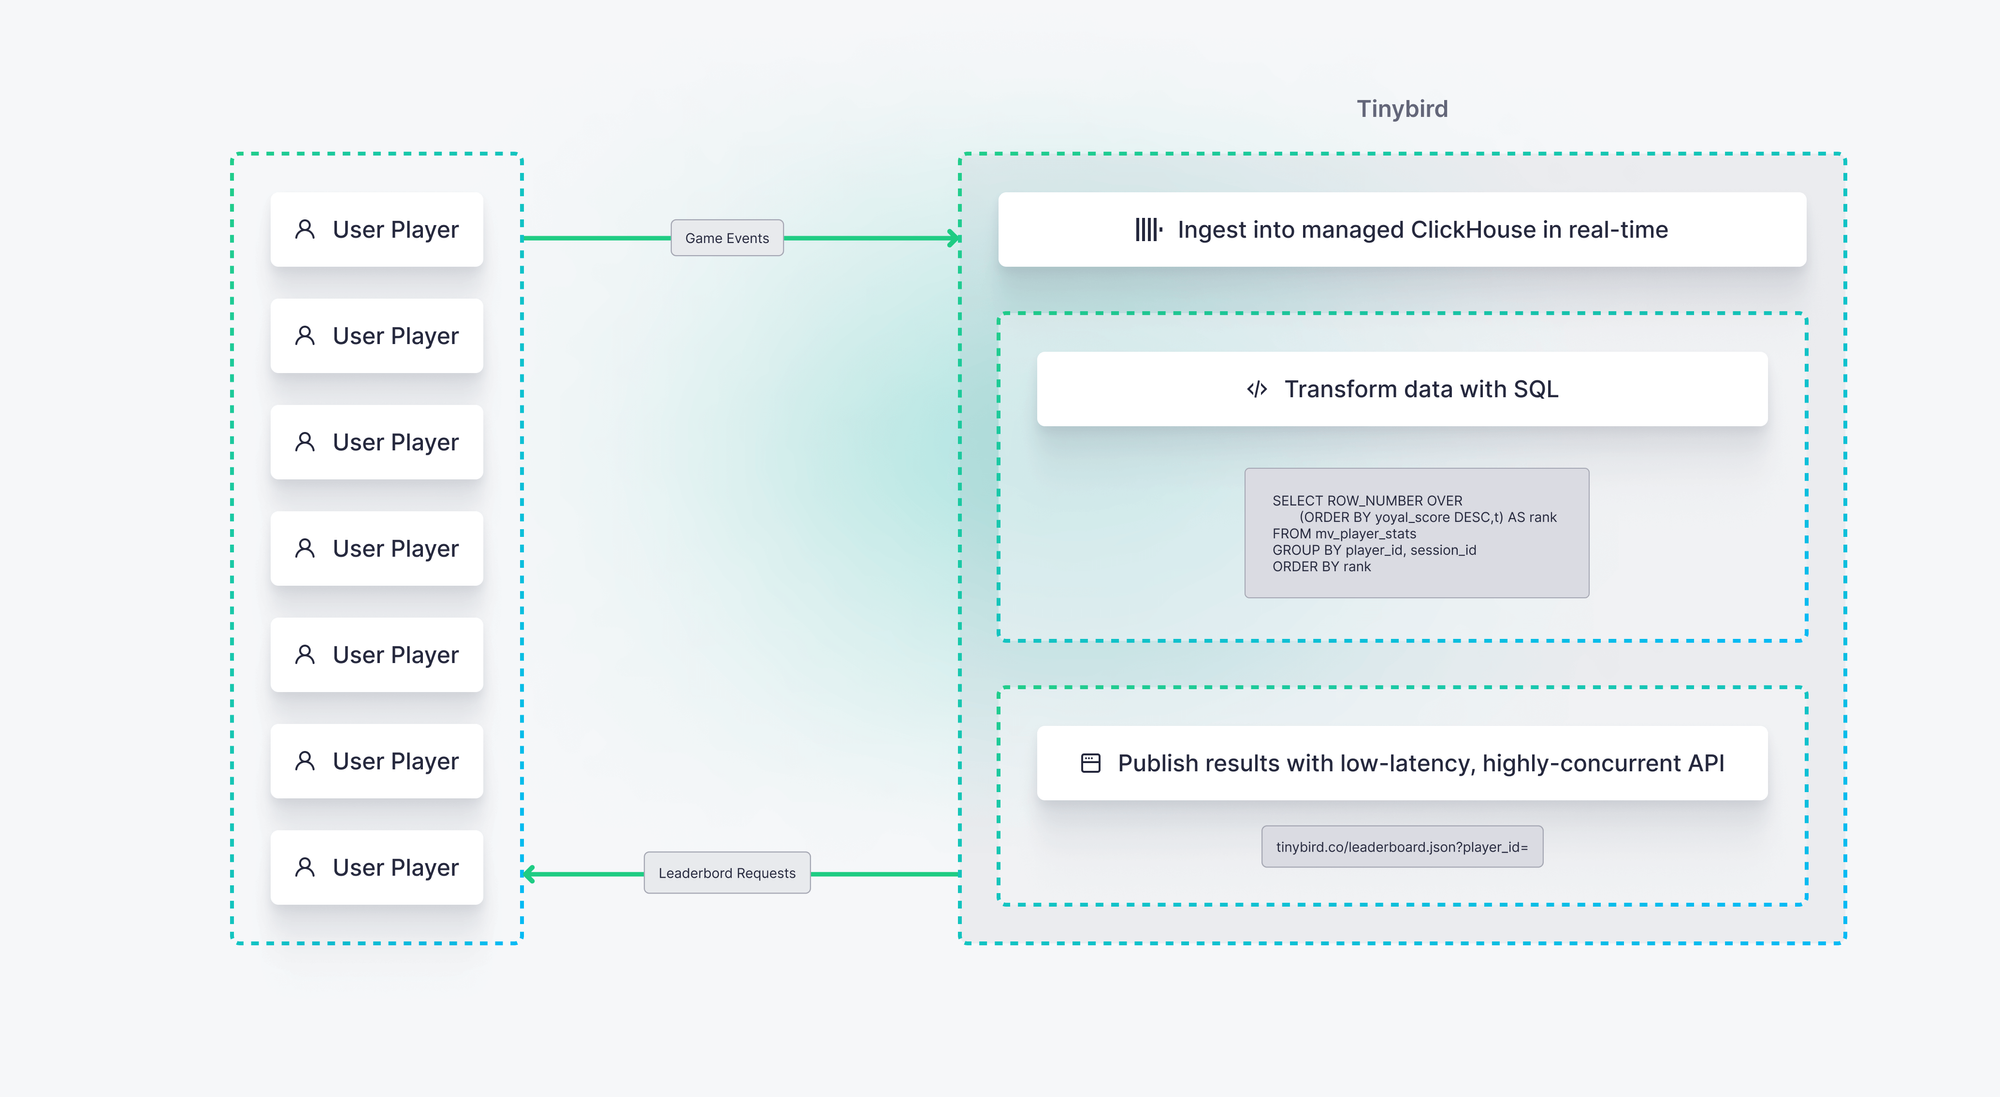
The following image depicts the pattern of our gaming leaderboard:
- App backend streams the events to Tinybird.
- Leaderboard requests are made to a Tinybird-hosted API endpoint.
- Leaderboard data is generated based on up-to-the-second event data.
- Frontend application renders the results.
Implement Pipes in Tinybird
Now, let's get into the details of how the leaderboard is implemented in Tinybird.
With the game events streaming into a Data Source named `game_events`, we create a Pipe named 'leaderboard' and create a Node named 'get_scores'. That node retrieves the 'score' events with this SQL:
Next, a second Node named 'rank_score' is created to select the top ten scores. Notice that this query selects from the previous 'get_scores' Node:
Publish Pipes as API endpoints
With this second Node, we have a data view that generates a top 10 leaderboard of player scores. With the click of a button, we can publish this Node as an API Endpoint. Endpoints inherit their name from the Pipe, so we can now request a leaderboard from https://api.tinybird.co/v0/pipes/leaderboard.json. Even with this straightforward implementation, it can handle thousands of concurrent users, all receiving leaderboard data based on the latest live game events.
This is a simplified example to illustrate the core functionality. The ‘production’ version of the leaderboard is enhanced in two key ways. First, the leaderboard was extended to support a player_id query parameter. This allows players to see their own score blended into the leaderboard data. This adds some gamification to personalize the leaderboard experience and likely motivates players to improve their scores.
Second, a Materialized View (MV) was implemented to optimize performance. MVs are pre-computed snapshots of frequently used queries. In this case, the MV would pre-calculate the top scores, and merge those with recently received events. This significantly improves query performance by reducing the amount of data that needs to be processed for each leaderboard request.
As you add user-facing leaderboard features, you will likely want to add these enhancements. To see how the ‘production’ Pipe is defined, check out its Pipe definition in the project Tiny Flappybird GitHub repository. There you will see how the user stats are blended in the second Node, and how the third Node combines the results with a UNION ALL clause. Note that this query selects from a MV named ‘mv_player_stats’. Check out the mat_player_stats.pipe file to see the definition of the Pipe that populates the MV.
Consuming the API endpoint
To display the leaderboard data in your application, you'll make an API request to the Tinybird endpoint you published. This endpoint URL will likely look something like https://api.tinybird.co/v0/pipes/leaderboard.json. The exact format of the URL will depend on how you name your Tinybird Pipe and what query parameters you support.
The specific way you make the API request will depend on the front-end framework you're using (Next.js, React, Angular, Vue.js, etc.). There are many libraries available to simplify making HTTP requests in JavaScript. In general, you'll use the fetch API or a library built on top of fetch to make a GET request to the Tinybird endpoint.
However you make the GET request, you will want to implement JSON Web Tokens (JWTs). These tokens allow your application to call Tinybird API Endpoints from the frontend without proxying via your backend. To see example code, check out this code-driven guide for implementing with Next.js. This example code demonstrates how to sign the token on your server.
Once you receive the response from the API, you'll parse the JSON data and use it to populate your leaderboard UI. This might involve dynamically generating HTML elements or updating the content of existing elements to display the player names, scores, and rankings.
Summary
As we've explored, leaderboards can be a valuable tool for user engagement, gamification and motivation in various applications. They can be implemented with different scopes (public, group, private) and require considerations for security and user data. Importantly, for an optimal user experience, leaderboards should leverage real-time data.
Tinybird simplifies the process of building real-time leaderboards. It excels at ingesting high-velocity data, querying it with low latency, and creating API endpoints for scalable data access. We saw how Tinybird can be used to construct a leaderboard pipeline for a Flappybird game, efficiently processing events, ranking scores, and publishing the results as an API endpoint.
Next steps
- Read more about developing user-facing analytics with Tinybird in the User-Facing Analytics: Examples, Use Cases, and Resources blog post.
- Learn about using JWTs with your application development.
- Learn more about designing APIs with Tinybird:
- Check out the Flappy Tinybird game, code and repository.
To learn more about Tinybird, check out the documentation. Ready to get started? Sign up for free with no time limit and no credit card required.
Want to talk through your leaderboard use cases with real-time data experts? Join our public Slack community to ask questions, get optimization tips, and learn from other developers building user-facing analytics with Tinybird.