PricingDocs
Bars

Data Platform

Managed ClickHouse
Production-ready with Tinybird's DX
Streaming ingestion
High-throughput streaming ingest
Schema iteration
Safe migrations with zero downtime
Connectors
Plug and play Kafka, S3, and GCS

Developer Experience

Instant SQL APIs
Turn SQL into an endpoint
BI & Tool Connections
Connect your BI tools and ORMs
Tinybird Code
Ingest and query from your terminal

Enterprise

Tinybird AI
AI resources for LLMs and agents
High availability
Fault-tolerance and auto failovers
Security and compliance
Certified SOC 2 Type II for enterprise
Sign inSign up
Product []

Data Platform

Managed ClickHouse
Production-ready with Tinybird's DX
Streaming ingestion
High-throughput streaming ingest
Schema iteration
Safe migrations with zero downtime
Connectors
Plug and play Kafka, S3, and GCS

Developer Experience

Instant SQL APIs
Turn SQL into an endpoint
BI & Tool Connections
Connect your BI tools and ORMs
Tinybird Code
Ingest and query from your terminal

Enterprise

Tinybird AI
AI resources for LLMs and agents
High availability
Fault-tolerance and auto failovers
Security and compliance
Certified SOC 2 Type II for enterprise
PricingDocs
Resources []

Learn

Blog
Musings on transformations, tables and everything in between
Customer Stories
We help software teams ship features with massive data sets
Videos
Learn how to use Tinybird with our videos
ClickHouse for Developers
Understand ClickHouse with our video series

Build

Templates
Explore our collection of templates
Tinybird Builds
We build stuff live with Tinybird and our partners
Changelog
The latest updates to Tinybird

Community

Slack Community
Join our Slack community to get help and share your ideas
Open Source Program
Get help adding Tinybird to your open source project
Schema > Evolution
Join the most read technical biweekly engineering newsletter

Our Columns:

Skip the infra work. Deploy your first ClickHouse
project now

Get started for freeRead the docs
A geometric decoration with a matrix of rectangles.

Product /

ProductWatch the demoPricingSecurityRequest a demo

Company /

About UsPartnersShopCareers

Features /

Managed ClickHouseStreaming IngestionSchema IterationConnectorsInstant SQL APIsBI & Tool ConnectionsTinybird CodeTinybird AIHigh AvailabilitySecurity & Compliance

Support /

DocsSupportTroubleshootingCommunityChangelog

Resources /

ObservabilityBlogCustomer StoriesTemplatesTinybird BuildsTinybird for StartupsRSS FeedNewsletter

Integrations /

Apache KafkaConfluent CloudRedpandaGoogle BigQuerySnowflakePostgres Table FunctionAmazon DynamoDBAmazon S3

Use Cases /

User-facing dashboardsReal-time Change Data Capture (CDC)Gaming analyticsWeb analyticsReal-time personalizationUser-generated content (UGC) analyticsContent recommendation systemsVector search
All systems operational

Copyright © 2025 Tinybird. All rights reserved

|

Terms & conditionsCookiesTrust CenterCompliance Helpline
Tinybird wordmark
PricingDocs
Bars

Data Platform

Managed ClickHouse
Production-ready with Tinybird's DX
Streaming ingestion
High-throughput streaming ingest
Schema iteration
Safe migrations with zero downtime
Connectors
Plug and play Kafka, S3, and GCS

Developer Experience

Instant SQL APIs
Turn SQL into an endpoint
BI & Tool Connections
Connect your BI tools and ORMs
Tinybird Code
Ingest and query from your terminal

Enterprise

Tinybird AI
AI resources for LLMs and agents
High availability
Fault-tolerance and auto failovers
Security and compliance
Certified SOC 2 Type II for enterprise
Sign inSign up
Product []

Data Platform

Managed ClickHouse
Production-ready with Tinybird's DX
Streaming ingestion
High-throughput streaming ingest
Schema iteration
Safe migrations with zero downtime
Connectors
Plug and play Kafka, S3, and GCS

Developer Experience

Instant SQL APIs
Turn SQL into an endpoint
BI & Tool Connections
Connect your BI tools and ORMs
Tinybird Code
Ingest and query from your terminal

Enterprise

Tinybird AI
AI resources for LLMs and agents
High availability
Fault-tolerance and auto failovers
Security and compliance
Certified SOC 2 Type II for enterprise
PricingDocs
Resources []

Learn

Blog
Musings on transformations, tables and everything in between
Customer Stories
We help software teams ship features with massive data sets
Videos
Learn how to use Tinybird with our videos
ClickHouse for Developers
Understand ClickHouse with our video series

Build

Templates
Explore our collection of templates
Tinybird Builds
We build stuff live with Tinybird and our partners
Changelog
The latest updates to Tinybird

Community

Slack Community
Join our Slack community to get help and share your ideas
Open Source Program
Get help adding Tinybird to your open source project
Schema > Evolution
Join the most read technical biweekly engineering newsletter
Back to Blog
Share this article:
Back

Simple statistics for anomaly detection on time-series data

Anomaly detection is a type of data analytics whose goal is detecting outliers or unusual patterns in a dataset.
I Built This!
Alberto Romeu
Alberto RomeuSoftware Engineer

Anomaly detection is a type of data analytics whose goal is detecting outliers or unusual patterns in a dataset.

When working with time-series data (time based network, systems or operational metrics) having a mechanism to detect contextual anomalies is useful to take action on potential risks (such a DDoS attack), system failures and corrections (like a sudden decrease in stock or sales) or business opportunities (such as an unexpected raise on a product’s sales).

Z-score to the rescue

You can detect contextual anomalies in time-series applying simple statistics, such as Z-score.

The Z-score measures how far a data point is away from the mean as a signed multiple of the standard deviation. Large absolute values of the Z-score suggest an anomaly.

zscore = (x - avg) / stddev

  • x is the current value of the data point you are evaluating
  • avg is the mean of the population
  • stddev is the standard deviation of the population

Testing a Z-score based algorithm for anomaly detection

Let’s see an application of the Z-score for real-time anomaly detection:

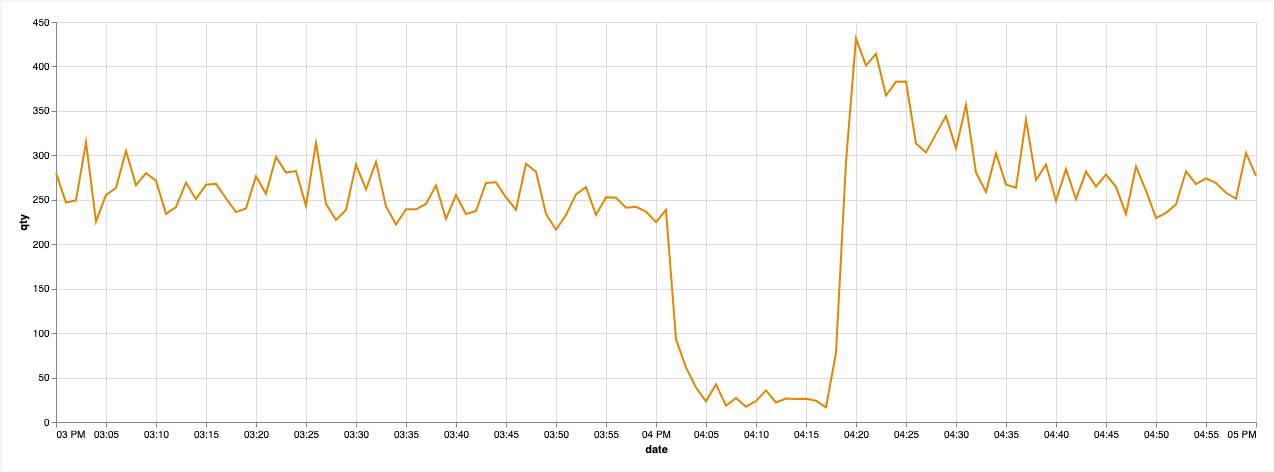
In the graph above, the x-axis represents time and the y-axis a quantity. We want to get notified when such kind of an anomaly takes place in the data, in this case an unusual decrease in the quantity.

First thing is choosing a data context:

In time-series, nearby data points tend to be more similar than far away data points.

That means most of the time the best context is last n minutes of data given a data point you want to evaluate. Or if you want to take into account seasonality, the same period of time for the previous day, month or year.

A very basic anomaly detection algorithm would be:

  • Take 30 minutes of data prior to a given timestamp.
  • Remove outliers from the sample, and calculate the average and standard deviation of your metric (you could use median based statistics as well).
  • Calculate the Z-score for a series of data points, comparing to the context average and standard deviation.
  • To avoid locality in the anomalies, do some aggreggations. For instance, you can work in groups of ten seconds and consider an anomaly if the Z-score is beyond the threshold during a period of time.
  • Return ‘ok’ or ‘error’ depending on the Z-score value, a threshold of ±2 would work.

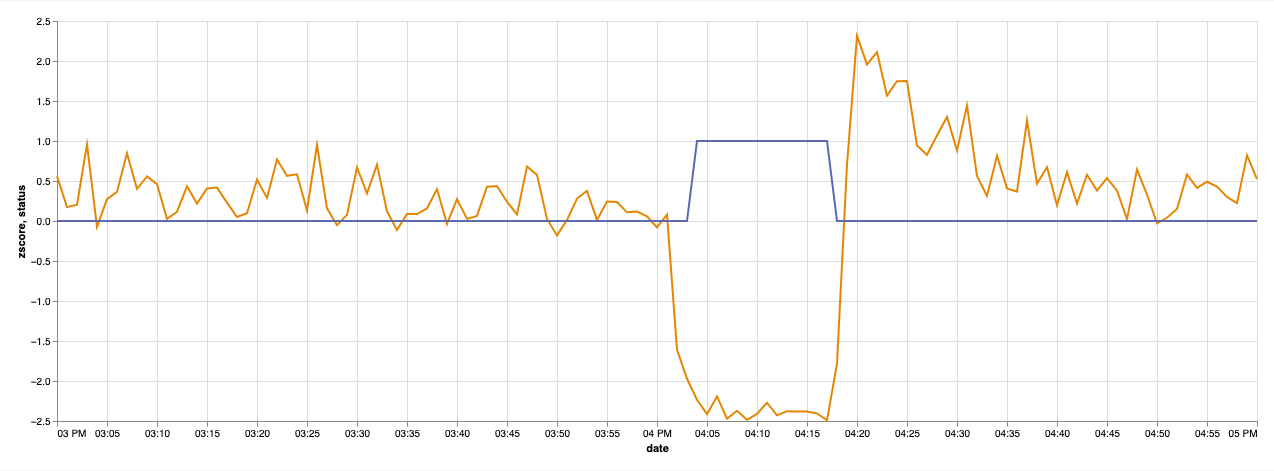
In the graph above, for any period in which the zscore is under -2 (which is a value that makes sense statistically) the anomaly status is 1 which means there’s a contextual anomaly, otherwise it’ll return 0.

You can find here an example of a Z-score based anomaly detection algorithm written in SQL.

Real-time anomaly detection

Anomaly detection systems are really valuable when you can react to unexpected events as they happen. You need a product that has at least these three features:

  • Able to handle large production datasets, updated very frequently, ideally from an events stream (think for instance in the volume of HTTP requests coming from a CDN provider)
  • Customizable: Even when you use an algorithm that can learn from itself, it’s sometimes required some domain knowledge to support corner cases, avoid false positives, etc.
  • Easy to integrate: Anomaly detection is just one step of the process, but then you might need integrate to an alerting system, a visualization software to understand or explore the data, or some capabilities for actionable outputs.

Caveats

Some caveats when manually building this kind of anomaly detection processes:

  • Normalize your data: quantities in the same units, dates in the same timezone, etc.
  • When talking about real-time, make sure everyone understands it as something that happened in the last 10 to 20 seconds.
  • Avoid false positives as much as possible. There’s nothing worse in an alerting system, than being notified from events that don’t require your attention.
  • Add context to your notifications: a graph snapshot of the time-series and data point that fired the alert, brief explanation on the reason, thresholds configured, actionable links or tools for further exploration, etc.

A real example

One of Tinybird’s customers, a large retailer, wishes to be notified of sudden changes in their sales numbers. If something is preventing sales or causing sales to spike, they want to know about it immediately.

How we do it:

  • We ingest all sales transactions in real-time using our Kafka Connector.
  • Since the transactions are in JSON, we extract and materialize on ingestion all the values we need onto another Tinybird data source.
  • We write our anomaly detection logic in SQL in a Tinybird Pipe that we expose as an API endpoint.
  • We query the endpoint every X seconds: if we detect an anomaly, an alert is triggered (in this case, a message in a Microsoft Teams chat)

Alerts of course is just one way to exploit real-time data. What’s interesting about doing this with Tinybird is that, once you have ingestion set up, you can do many more things with that data.

Those transactions can be used for real-time analysis, to build data products such as operational dashboards, to build analytics for end-consumers, to expose APIs for other areas of the organization and much more. Every new use case is just one SQL query away.

Do you like this post? Spread it!

Skip the infra work. Deploy your first ClickHouse
project now

Get started for freeRead the docs
A geometric decoration with a matrix of rectangles.

Product /

ProductWatch the demoPricingSecurityRequest a demo

Company /

About UsPartnersShopCareers

Features /

Managed ClickHouseStreaming IngestionSchema IterationConnectorsInstant SQL APIsBI & Tool ConnectionsTinybird CodeTinybird AIHigh AvailabilitySecurity & Compliance

Support /

DocsSupportTroubleshootingCommunityChangelog

Resources /

ObservabilityBlogCustomer StoriesTemplatesTinybird BuildsTinybird for StartupsRSS FeedNewsletter

Integrations /

Apache KafkaConfluent CloudRedpandaGoogle BigQuerySnowflakePostgres Table FunctionAmazon DynamoDBAmazon S3

Use Cases /

User-facing dashboardsReal-time Change Data Capture (CDC)Gaming analyticsWeb analyticsReal-time personalizationUser-generated content (UGC) analyticsContent recommendation systemsVector search
All systems operational

Copyright © 2025 Tinybird. All rights reserved

|

Terms & conditionsCookiesTrust CenterCompliance Helpline
Tinybird wordmark

Related posts

I Built This!
May 27, 2021
Analyzing artists performance in real-time with Tinybird
Javier Álvarez Medina
Javier Álvarez MedinaCo-founder
1Analyzing artists performance in real-time with Tinybird
I Built This!
Apr 21, 2019
Simple Time Series Prediction Modeling Using Tinybird
Javi Santana
Javi SantanaCo-founder
1Simple Time Series Prediction Modeling Using Tinybird
Product updates
Jun 25, 2021
Changelog #15: improved data flow graph, anomaly detection and more
Tinybird
TinybirdTeam
1Changelog #15: improved data flow graph, anomaly detection and more
I Built This!
Mar 19, 2020
Enriching Kafka streams for real-time queries
Jorge Sancha
Jorge SanchaCo-founder
1Enriching Kafka streams for real-time queries
I Built This!
Nov 14, 2023
Using Tinybird for real-time marketing at Tinybird
Cameron Archer
Cameron ArcherTech Writer
1Using Tinybird for real-time marketing at Tinybird
I Built This!
Dec 11, 2023
8 example projects to master real-time data engineering
Cameron Archer
Cameron ArcherTech Writer
18 example projects to master real-time data engineering
I Built This!
Oct 17, 2025
Building real-time, generative UIs for analytics with Tinybird and Thesys
Zahle K.
Zahle K.Founding Engineer at Thesys
1Building real-time, generative UIs for analytics with Tinybird and Thesys
I Built This!
Jul 11, 2025
Turning Spain's blackout into real-time insights
Iago Enríquez
Iago EnríquezData Engineer
1Turning Spain's blackout into real-time insights
I Built This!
May 09, 2023
How to build a real-time fraud detection system
Joe Karlsson
Joe KarlssonDeveloper Advocate
1How to build a real-time fraud detection system
I Built This!
May 02, 2021
Analyzing our own Nginx logs with ClickHouse on Tinybird
Xoel López
Xoel LópezFounder at TheirStack
1Analyzing our own Nginx logs with ClickHouse on Tinybird