Today we’re launching the jobs_log a new Service Data Source to dramatically improve insight into background jobs. As with any Service Data Source, just query it like a table (SELECT * FROM tinybird.jobs_log) to start analyzing background jobs in your Tinybird Workspace.
Tinybird is the real-time analytics platform for user-facing applications. Tinybird keeps data fast and fresh by working incrementally on data as it arrives. However, there are still various uses for long-running background tasks. You might want to create scheduled, static snapshots of a dataset using Copy Pipes, or backfill an incremental materialized view with historical data. These run as background jobs.
Until today, visibility into jobs was only possible via the Jobs API, which has limitations on the time window, log retention, and level of details. The Jobs API will remain available and is useful as a simple way to look up the status of a single job. For production-level monitoring, the jobs_log bring major improvements to job observability:
- Detailed job insights: Monitor background job runs, gather statistics for specific job types, track ongoing jobs, identify errored jobs, and analyze queue timings.
- Extended Log Retention: Access logs of background jobs for up to 12 months.
- Unlimited Records: There is no limit to the number of records in the log, so all jobs and events will be tracked and available for the entire retention period.
- Centralized Monitoring: Available in all Tinybird Workspaces as tinybird.jobs_log. For Organization Admins, you can monitor jobs across all Organization Workspaces using
organization.jobs_log.
How to use it
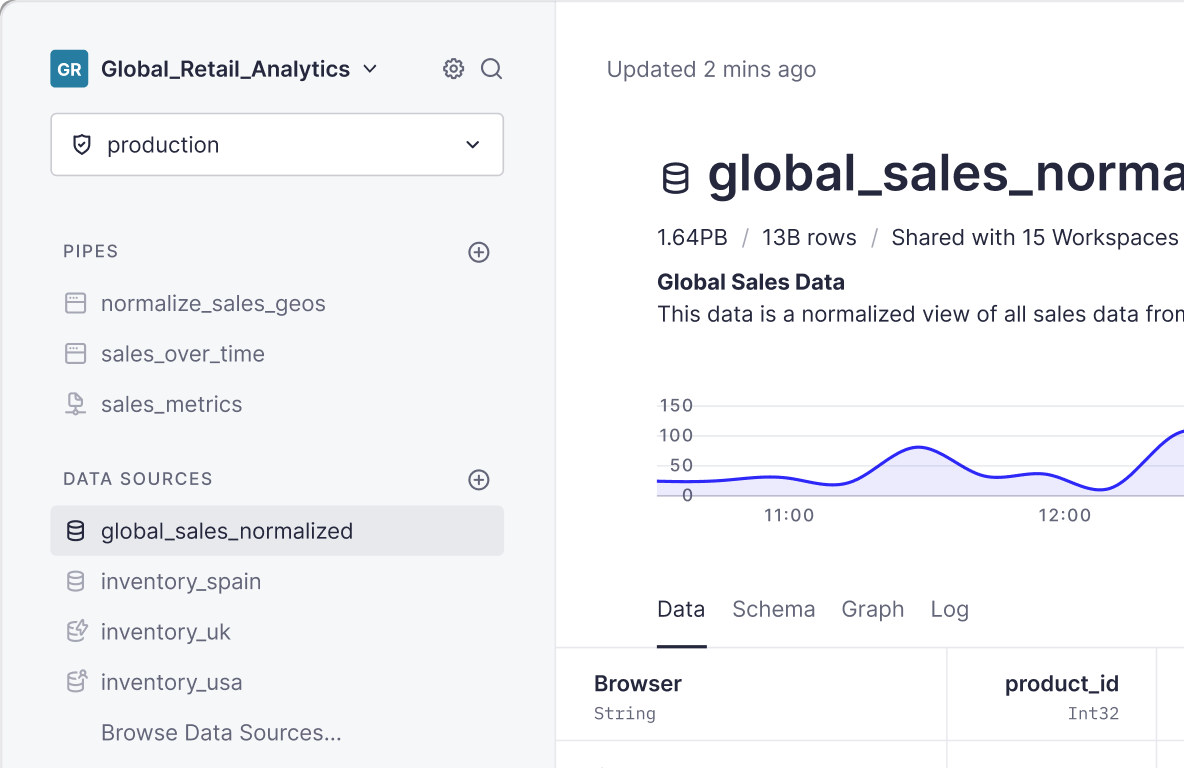
The jobs_log can be used like any other Data Source. In a Pipe or Playground, write a SQL query using tinybird.jobs_log as the table in your FROM clause. As it’s just a Data Source, you can use this to publish API Endpoint and build Charts over your observability data.
Here’s an example of querying the jobs_log to build a time series of job status for the past week:
Just like any other Data Source, you can query jobs_log in a Pipe to create API Endpoints and Charts. Here's a quick visualization over our status time series using Tinybird Charts:
And here’s an example showing how an Organization Admin can use the organization.jobs_log to determine the Workspace creating the most jobs:
And you can visualize this as a top 5 bar list using Tinybird Charts like so:
If you're not yet a customer, you can get started with Tinybird today, with no credit card required. Check out our documentation (including advanced use cases we've employed with some of our customers) to learn more about the jobs_log, and join our Slack community if you have any questions!